Average true range in forex
Forex trading is a complex activity that requires traders to analyze various market factors to make informed decisions. One such factor that can help traders understand market volatility and manage risk is the Average True Range (ATR). ATR is a technical indicator used to measure the level of price volatility in a market. It was developed by J. Welles Wilder Jr. in the 1970s and has since become a popular tool for traders.
ATR is a crucial tool for traders as it helps them identify potential market opportunities and risks. By measuring the volatility of a market, traders can determine the level of risk associated with a particular trade. This information can then be used to set stop-loss and take-profit levels, helping traders to manage their risk effectively. Additionally, ATR can be used to identify trends in a market and create trading strategies that take advantage of these trends.
J. Welles Wilder Jr. developed the ATR indicator as part of his series of technical analysis tools, including the Relative Strength Index (RSI) and the Parabolic SAR. ATR was designed to help traders measure the volatility of a market and make informed decisions based on this information. Since its development, ATR has become a popular tool for traders in various markets, including forex trading. With the rise of technology and the availability of trading software, ATR has become more accessible than ever before, making it easier for traders to use this indicator in their trading strategies.
Explanation of ATR Formula.
To calculate ATR, traders use a specific formula that takes into account the range of price movements over a set period. The ATR formula is:
ATR = [(Previous ATR x 13) + Current True Range] / 14
The true range is the greatest of the following:
The difference between the current high and the current low
The absolute value of the difference between the previous close and the current high
The absolute value of the difference between the previous close and the current low.
Example of ATR Calculation.
Let's take an example to understand how to calculate ATR. Assume that we are using a 14-period ATR and the previous ATR was 1.5. The current price movements are as follows:
Current high: 1.345
Current low: 1.322
Previous close: 1.330
Using the formula, we can calculate the current true range as follows:
Difference between current high and current low: 1.345 - 1.322 = 0.023
Absolute value of the difference between previous close and current high: |1.345 - 1.330| = 0.015
Absolute value of the difference between previous close and current low: |1.322 - 1.330| = 0.008
The greatest value of these is 0.023, which is the current true range. Plugging this value into the ATR formula, we get:
ATR = [(1.5 x 13) + 0.023] / 14 = 1.45
Therefore, the current ATR value is 1.45.
Importance of Understanding ATR Calculation.
Understanding how to calculate ATR is crucial for traders as it helps them interpret the values of this indicator correctly. By knowing how ATR is calculated, traders can make informed decisions based on the current market volatility. For instance, if the ATR value is high, it indicates that the market is experiencing high volatility, and traders may need to adjust their stop-loss and take-profit levels accordingly. On the other hand, a low ATR value suggests that the market is relatively stable, and traders may need to adjust their strategies accordingly. Therefore, understanding ATR calculation is essential for traders who want to use this indicator effectively in their trading strategies.
Identifying Market Volatility Using ATR.
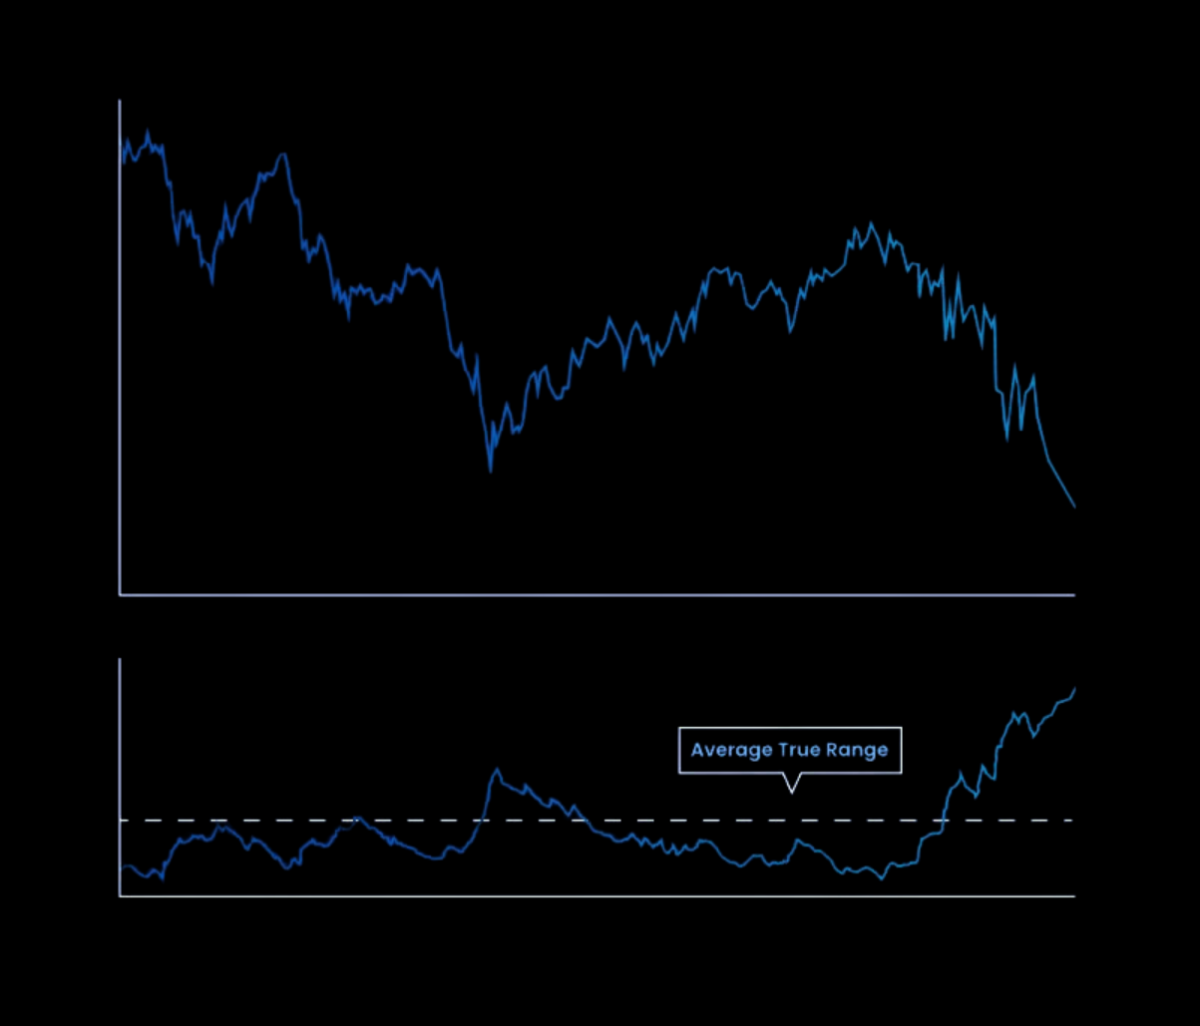
The primary use of ATR in forex trading is to identify the level of market volatility. High ATR values indicate that the market is experiencing increased volatility, whereas low ATR values suggest that the market is relatively stable. By monitoring the ATR values, traders can adjust their trading strategies accordingly. For example, if the ATR value is high, traders may consider widening their stop-loss levels to avoid being stopped out by short-term market movements.
Determining Stop Loss and Take Profit Levels Using ATR.
Another important use of ATR in forex trading is to determine stop-loss and take-profit levels. Traders can use the ATR value to calculate the optimal distance for setting their stop-loss and take-profit levels. A common approach is to set the stop-loss level at a multiple of the ATR value. For example, a trader may set their stop-loss level at 2x the ATR value, which means that their stop-loss level will adjust to the current market volatility. Similarly, traders can set their take-profit levels at a multiple of the ATR value to capture profits while allowing for some flexibility in the market movements.
Trading Strategies Using ATR.
ATR can be used in various trading strategies to improve trading performance. Here are some examples:
Trend-following strategies: Traders can use ATR to confirm the strength of a trend. If the ATR value is high, it indicates that the trend is strong, and traders may consider entering a long or short position, depending on the direction of the trend.
Volatility breakout strategies: Traders can use ATR to identify price breakouts that occur when the market experiences high volatility. In this strategy, traders enter a long or short position when the price breaks out of a range, and the ATR value confirms that the market is experiencing increased volatility.
Stop-loss placement strategies: Traders can use ATR to adjust their stop-loss levels based on the current market volatility. For example, if the ATR value is high, traders may widen their stop-loss levels to avoid being stopped out by short-term market movements.
In conclusion, ATR is a versatile indicator that can be used in various trading strategies to improve trading performance. By monitoring the ATR values, traders can adjust their trading strategies to the current market conditions and make informed decisions about their stop-loss and take-profit levels.
Comparison of ATR to Bollinger Bands.
Bollinger Bands is a popular volatility indicator that consists of three lines: a middle line, which is a simple moving average, and two outer lines that represent two standard deviations above and below the moving average. Bollinger Bands can be used to identify periods of low volatility and high volatility.
While ATR and Bollinger Bands are both used to measure volatility, they differ in their approach. ATR measures the true range of price movement over a period of time, while Bollinger Bands measure volatility based on standard deviation from a moving average.
One of the advantages of ATR over Bollinger Bands is that it is more sensitive to price changes. This means that ATR can detect volatility changes more quickly than Bollinger Bands. However, Bollinger Bands provide traders with more information on the direction of price movement, which is not offered by ATR.
Comparison of ATR to Moving Average Convergence Divergence (MACD).
Moving Average Convergence Divergence (MACD) is a trend-following momentum indicator that measures the relationship between two exponential moving averages. MACD consists of two lines: the MACD line and the signal line. The MACD line is the difference between two exponential moving averages, while the signal line is a moving average of the MACD line.
While both ATR and MACD can be used to identify trends in price movement, they differ in their approach. ATR measures the range of price movement, while MACD measures the relationship between two moving averages.
One of the advantages of ATR over MACD is that it provides traders with a clearer picture of market volatility. ATR can help traders identify potential changes in volatility before they occur, which can be useful when setting stop-loss and take-profit levels. Additionally, ATR can be used in a variety of trading strategies, while MACD is primarily used as a trend-following indicator.
Advantages and disadvantages of ATR over other volatility indicators.
ATR has several advantages over other volatility indicators. First, ATR is more sensitive to price changes than other indicators, which means that it can detect changes in volatility more quickly. Additionally, ATR can be used in a variety of trading strategies, including trend-following and mean-reversion strategies.
However, ATR also has some limitations. One disadvantage of ATR is that it does not provide traders with information on the direction of price movement, which is provided by other indicators such as Bollinger Bands. Additionally, ATR can be more difficult to interpret than other indicators, particularly for new traders.
Case Study: Using ATR in a Forex Trading Strategy.
Let's consider a simple trading strategy that uses ATR to set stop loss and take profit levels. Suppose we want to buy a currency pair when its price breaks above the 50-day moving average and the ATR is higher than 0.005. We will set the stop loss at the low of the previous candle, and the take profit at two times the ATR. If the take profit is not hit, we will exit the trade at the end of the trading day.
To illustrate this strategy, let's consider the EUR/USD currency pair from January 2022 to March 2022. We will use the ATR indicator on the MetaTrader 4 platform to calculate the ATR value.
The chart shows the buy signals generated by the strategy, marked by the green arrows. We can see that the strategy generated a total of six trades, four of which were profitable, resulting in a total profit of 1.35%.
Backtesting ATR-Based Strategies.
Backtesting is the process of testing a trading strategy using historical data to see how it would have performed in the past. This is a useful tool for evaluating the performance of a strategy and identifying any weaknesses.
To backtest an ATR-based strategy, we need to first define the rules of the strategy, as we did in the previous section. We then need to apply these rules to historical data to generate buy and sell signals, and calculate the profits and losses of the trades.
There are many tools available for backtesting, including trading platforms like MetaTrader 4 and specialized software like TradingView. These tools allow us to test a strategy using historical data and evaluate its performance.
Fine-Tuning ATR-Based Strategies.
Once we have tested an ATR-based strategy using historical data, we can fine-tune it to improve its performance. This involves adjusting the parameters of the strategy, such as the ATR threshold, stop loss and take profit levels, and the length of the moving average.
To fine-tune a strategy, we need to use statistical analysis and optimization techniques to identify the optimal values of the parameters. This can be a time-consuming process, but it can lead to significant improvements in the performance of the strategy.
One popular technique for fine-tuning strategies is called the genetic algorithm. This algorithm uses a population of potential solutions and evolves them over time by applying selection, crossover, and mutation operations to generate new solutions.
Conclusion.
In conclusion, the average true range (ATR) is an essential tool for forex traders looking to measure and analyze market volatility. By using ATR, traders can identify the potential size of market moves, set appropriate stop loss and take profit levels, and develop effective trading strategies.
ATR can be used in combination with other technical indicators such as Bollinger Bands and Moving Average Convergence Divergence (MACD), but it also has its unique advantages. ATR is easy to use and adaptable to different trading styles and timeframes. It can help traders avoid unnecessary risks and maximize their profits.
In practice, traders can use ATR to develop and backtest trading strategies. Fine-tuning an ATR-based strategy involves adjusting the parameters based on the current market conditions and the trader's risk tolerance.
The future outlook of ATR in forex trading is promising, as it continues to evolve and adapt to the changing market conditions. As the forex market becomes increasingly volatile and complex, ATR remains a reliable and effective tool for traders to navigate and succeed in the market.
