Bounce forex strategy
The edge that bounce forex trading strategy has over most forex trading strategies is that it helps forex traders to precisely predict the exact tops and bottoms of price moves and then enter very early on the trade in order to capture the bulk of any price move thereby making a lot of profit. This is possible on various financial market asset classes like stock, bonds, indices, options and so on.
Bounce forex strategy is applicable to any timeframe, charts or trading style such as swing trading, long term position trading, shorts term trading and scalping. The strategy can also be modified to fit a trader's competence.
What is bounce trading really all about
Imagine a ball bouncing continuously from up to down of different heights and base levels, sometimes with different momentum or speed in price movement and also in different price directions (bullish or bearish).
Picking the exact tops and bottoms of the bounce in price movement is the basis of the forex bounce strategy.
To trade the forex bounce strategy, traders will look for high probability setups that suggest that price will change its direction or bounce at some identified important support and resistance level.
What are this support and resistance bounce levels to be identified
Support and resistance play a significant role in technical analysis of the financial market. It enhances a clearer picture of the market structure in price movement and it also predicts high probability levels of reversal or change in price movement. Unlike the traditional method of drawing horizontal support and resistance bounce levels, this levels can be identified by different trading tools as specific price levels, zones or areas of interest. The trading tools are as follows;
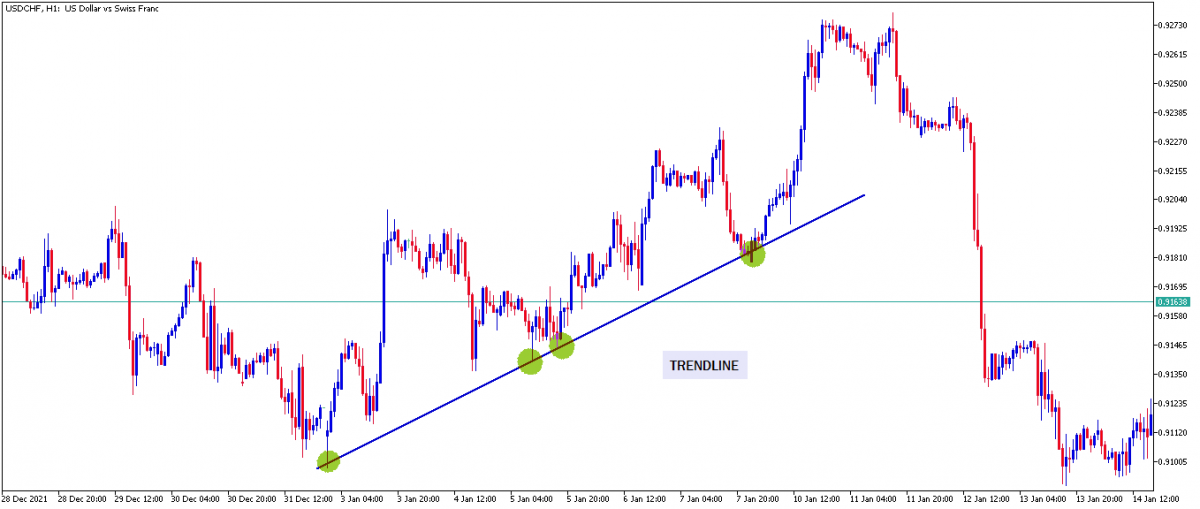
Trendlines: Trendline is a straight diagonal line connecting two or three highs or lows of price movement to identify future support levels of a bullish trend or future resistant levels of a bearish trend.
Example of a Bullish Trendline
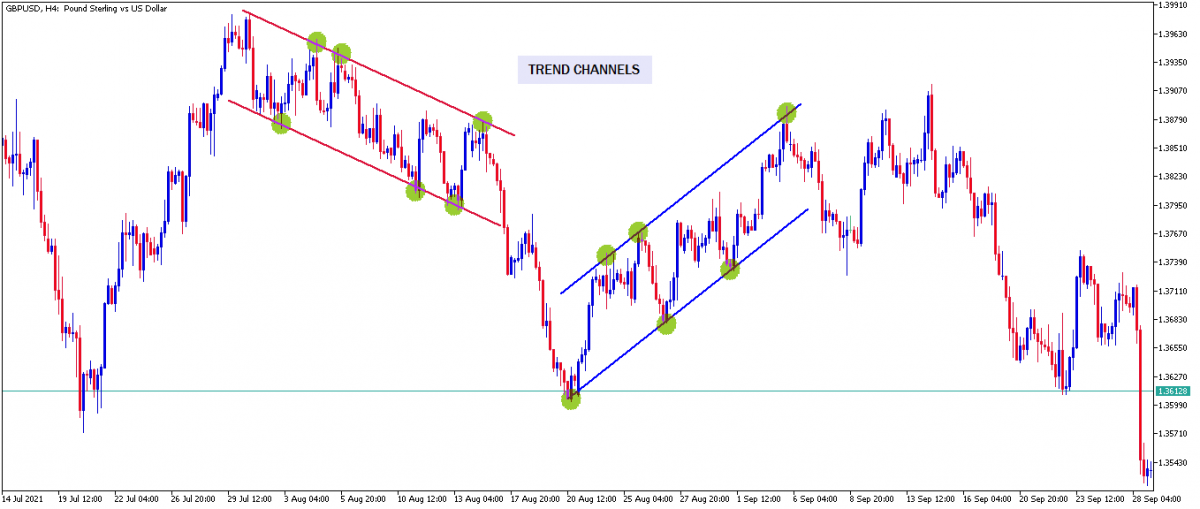
 Trend line channel: Also known as price channel, is a set of parallel trendline defined by the highs and the lows of a bullish or bearish price movement. The top diagonal line of the channel usually act as future reference points for resistance and lower diagonal line of the channel usually act as future reference points for support.
Example of a Bullish and Bearish Price Channel
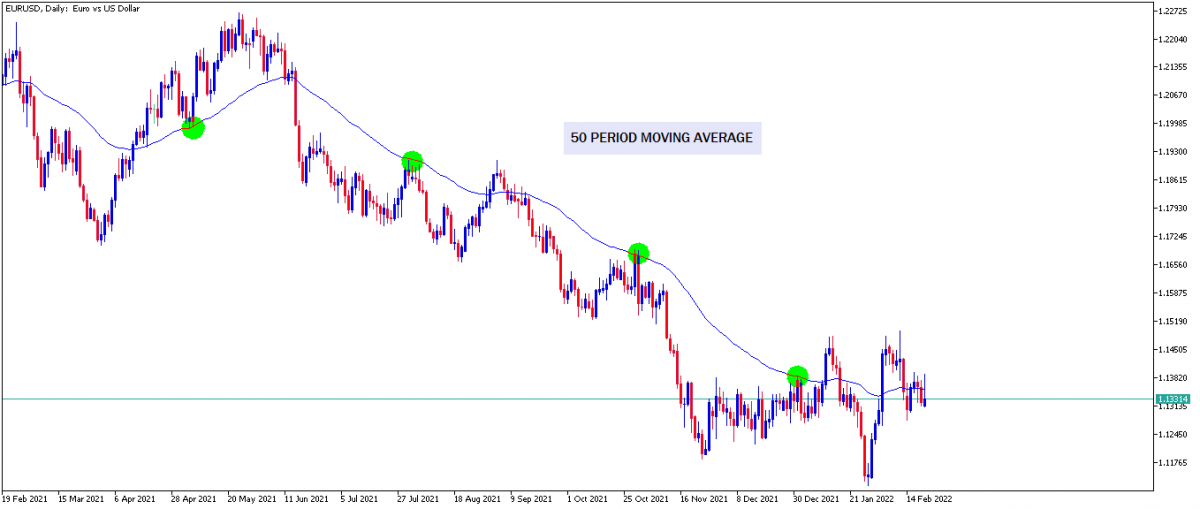
Moving averages : As discussed in one of our previous articles, moving averages are sloping lines that represent the calculated average of price movement over a certain period of time. The moving average line acts as dynamic support and resistance levels for bullish and bearish bounce in price movement.
Image of price movement bouncing above and below on a moving average.
Fibonacci retracement & extension levels: These are important ratios derived from a specific sequence of numbers that governs nature. The significant impact of these ratios extends to engineering, biology, construction and also forex trading. The ratio levels are of two types. First is the Fibonacci retracement levels; 27.6%, 38.2%, 61.8% and 78.6%.
The other is the Fibonacci extension levels; 161.8%, 231.6% and so on
Image of Fibonacci retracement and extension levels
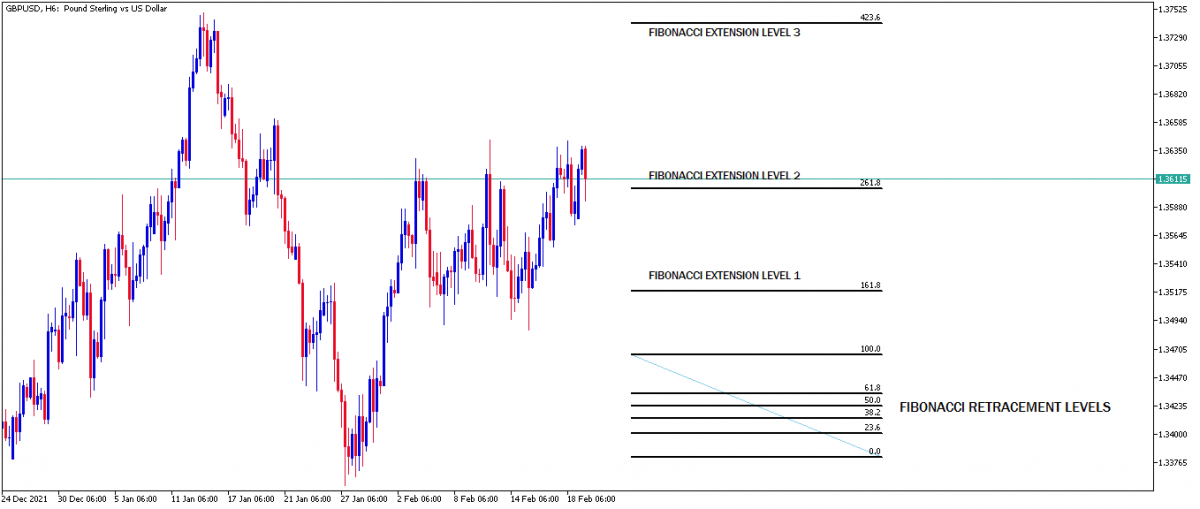
These levels are drawn horizontally when the Fibonacci tool is plotted on a defined price move.
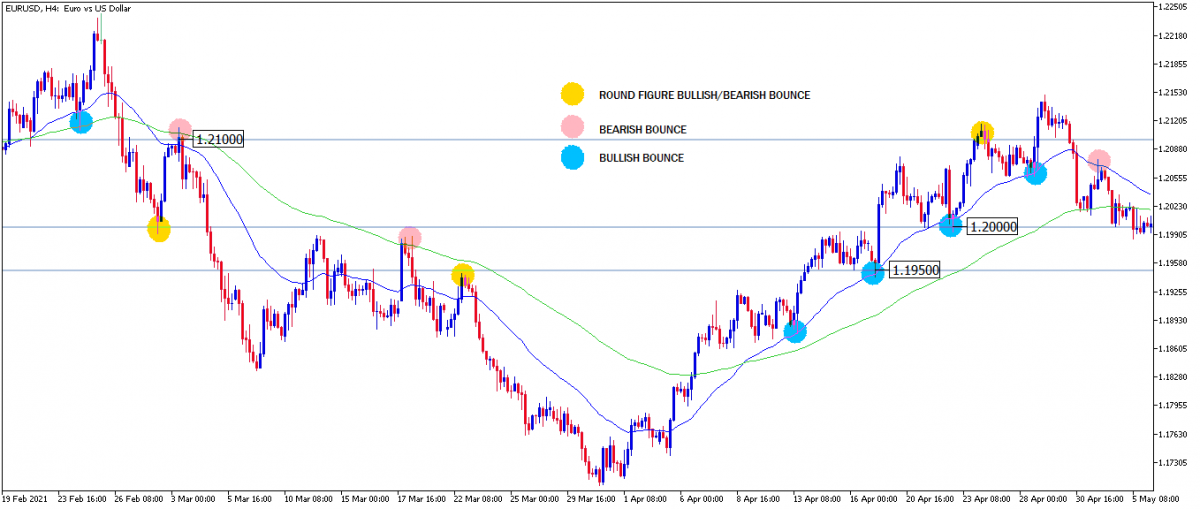
Institutional price level: These are price levels that end with round figures like (.0000) or mid figures like (.500). These significant price levels are often targets for the reaccumulation of long or short market orders by the major market participants.
An example of round figures and mid figures price levels identified on the EURUSD chart. 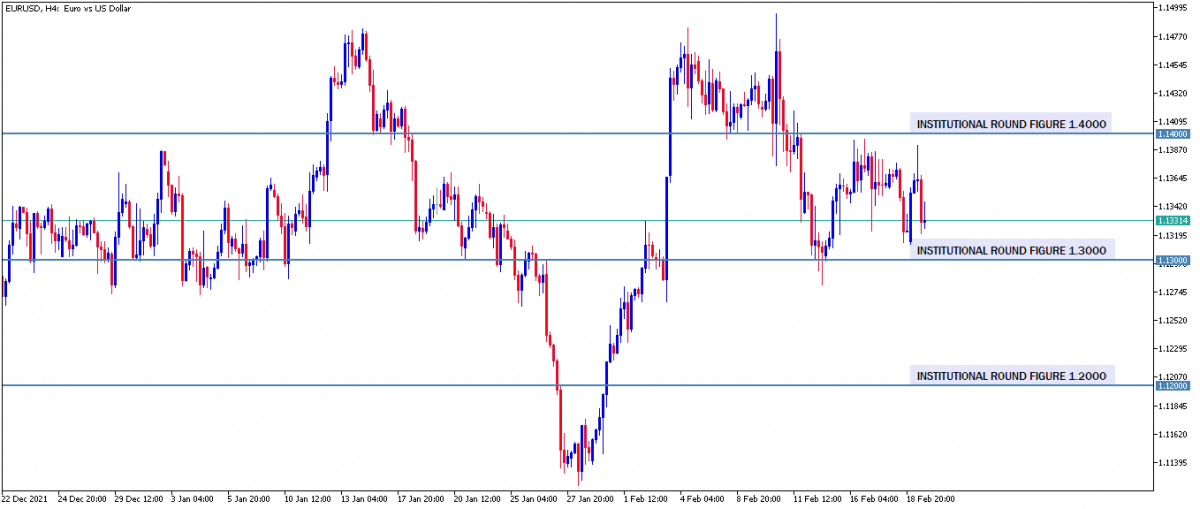
Pivot point: These are also important support and resistance levels based on specific calculations that can be used to identify high probability bounce trade setups.
These high probability bounce levels provided by these trading tools are meant to be identified and marked up as zones, significant price levels and areas of interest for the purpose of profit targets, trigger for trade entries and predetermined support and resistance levels to expect a bounce or a breakout bounce depending on the condition of the market.
Why will price movement bounce at this marked up levels
When there’s a decline in price movement towards a support level, regardless of the strength of the bearish momentum, if the major market participant accumulates a load of long position at the support level. Price will rally higher from that spot. This is known as a Bullish bounce.
Assume price trade through or break the support level. That level can act as resistance for a bearish bounce if it gets retested again. This is referred to as a Breakout Bearish Bounce.
Conversely, when there’s a rally in price movement towards a resistance level, regardless of the strength of the bullish momentum, if the major market participant accumulates a load of short position at the resistance level. The price movement will decline from that spot. This is known as a Bearish Bounce.
Assume price trade through or break the resistance level. That level can act as support for a bullish bounce if it gets retested again. This is referred to as Breakout Bullish Bounce.
Different approach to trading bounces in different market conditions
There are two primary cycles or conditions of price movement in the forex market known as the Trending and Consolidating Market Condition.
Trending market condition
In a Bullish Trend: The marked-up support levels can be used to predict high probable reversal spot for bullish price expansions in line with the bullish trend. This is usually after a bearish retracement.
In a Bearish Trend: The marked-up resistance levels can be used to predict high probable reversal spot for bearish price expansion in line with the bearish trend. This is usually after a bullish retracement.
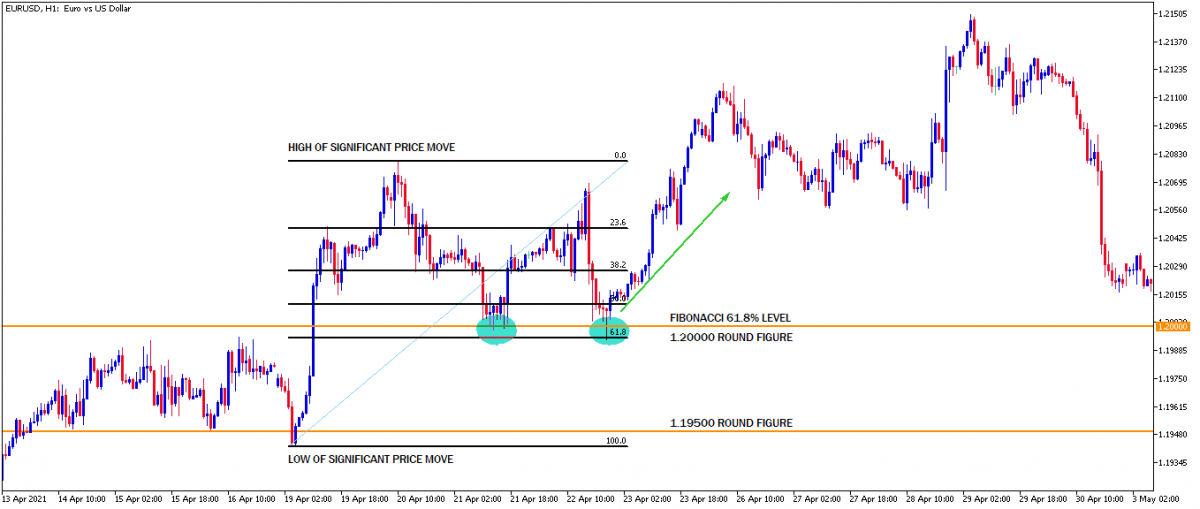
This is an example of a bullish bounce trade setup at the 61.8% level in confluence with a round figure price level (1.2000).
The two bounce setups originated from the retracement of a bullish price expansion in an uptrend.
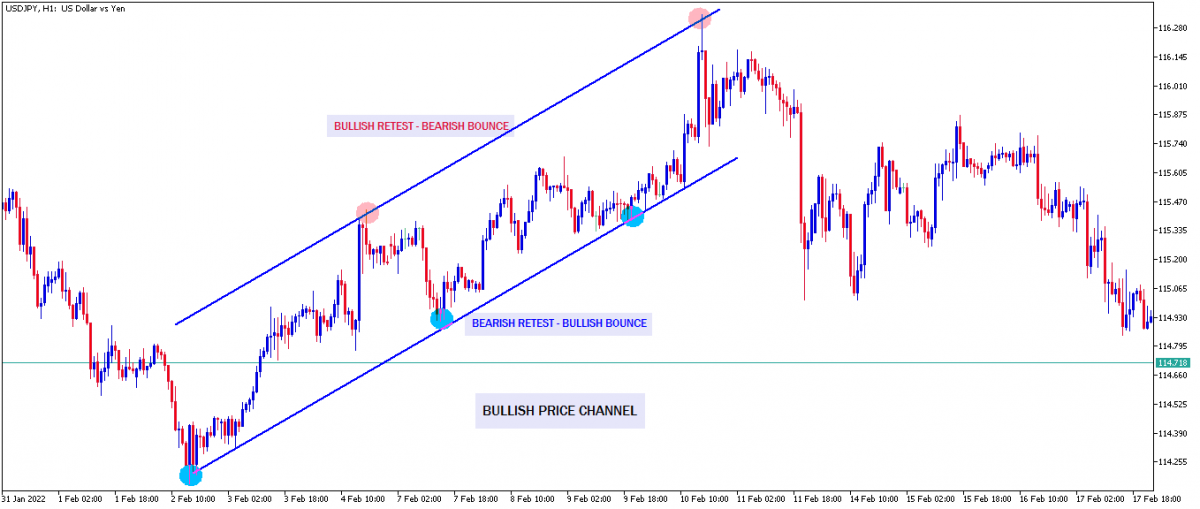
Another example is the Trend channel. As the name implies, it is usually plotted on a trend to predict high probability trend following and contrarian bounce setup. There are two examples here: The upward and the downward price channel. The small red circle implies a contrarian (bullish and bearish) bounce setup while the blue implies a trend following (bullish and bearish) bounce setup.
Image of Bearish Trend Channel
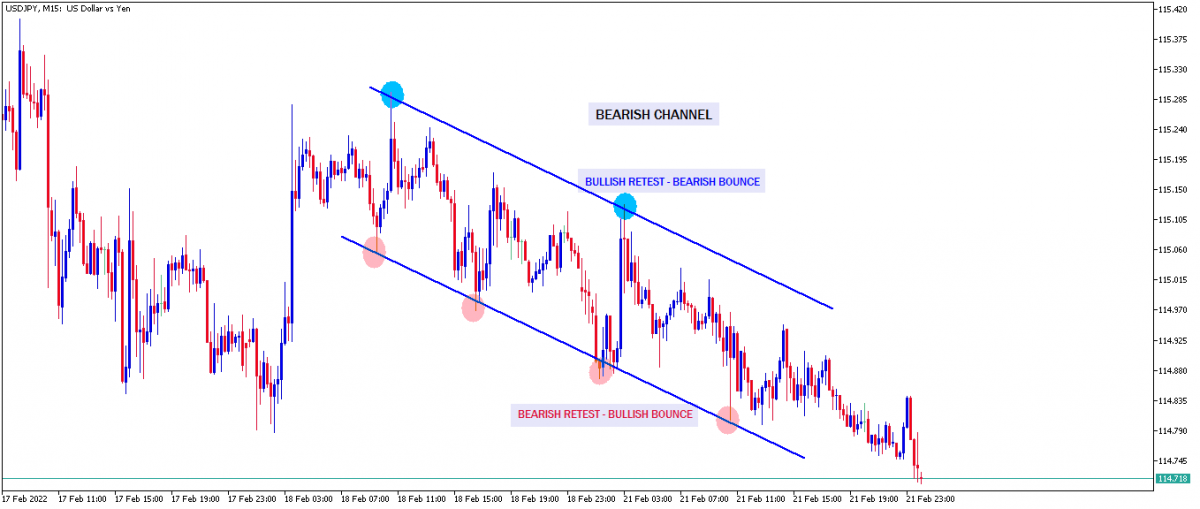 Image of Bullish Trend Channel
Another example is the high probability bullish and bearish bounce trade setups by two plotted moving averages. A short term and a long term moving average.
The small red circle indicates high probable bearish bounce from the moving average
The blue indicates high probable bullish bounce on the moving average
The gold indicates high probable bullish or bearish bounce when either of the moving average is in confluence with the institutional round figures.
Consolidating market condition
Sideway-consolidation price movements are more tricky to trade but even at that, trading bounces in a consolidating market can be made simple and easy by applying the right tools properly on the chart.
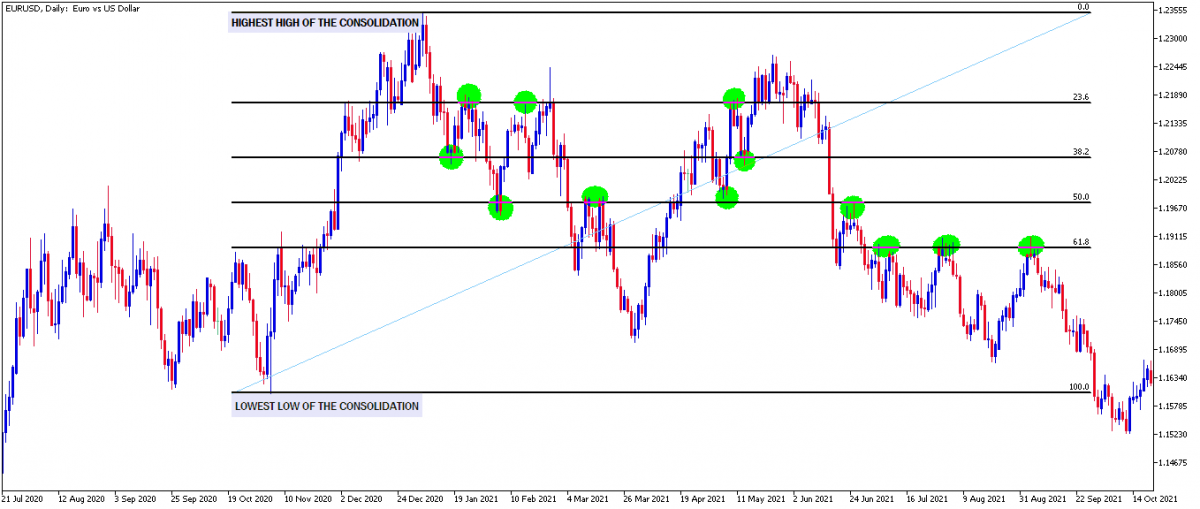
Approach 1: The Fibonacci levels can be used to find a high probability bounce trade setup in a consolidating market. Plot the Fibonacci tool from the highest high to the lowest low of price movement in a consolidation. High probability bounce trade setup will be found at the Fibonacci retracement and extension levels such as the 32.8%, 50%, 61.8%, 78.6%.
Example of fibonacci retracement level plotted over a large consolidation.
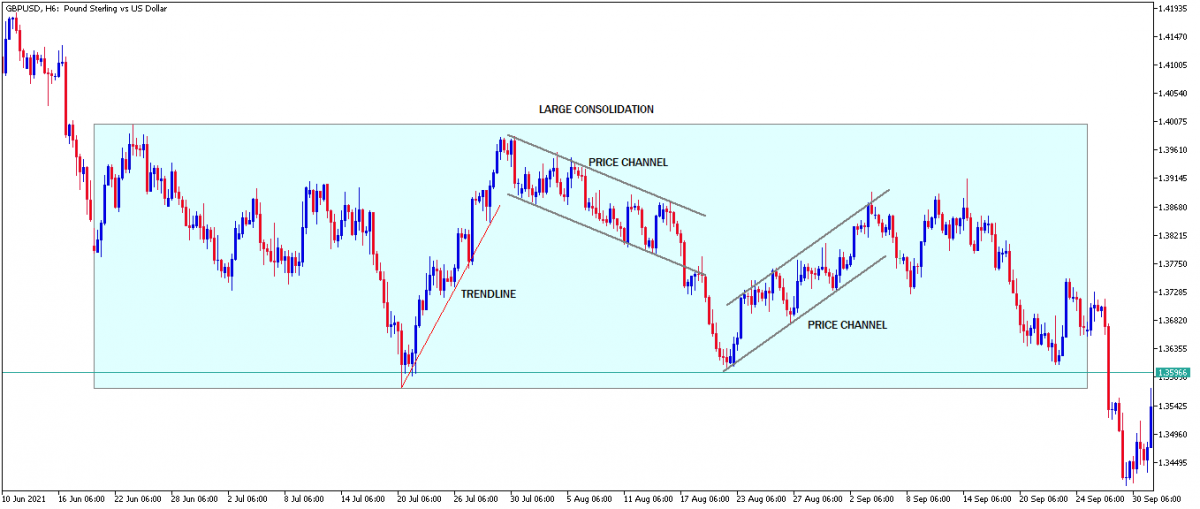
Approach 2: In a large consolidation, there is usually an overlap of a mini trend in a large consolidation and so trendlines and channels can be used to predict high probable tops and bottoms of a smaller trend in a large consolidation.
Example of trendlines and channels used to identify high probable bounce trade setup in a large consolidation.
Opening trade positions
The ability to open trade setups at the right time with the right entry method is very vital for risk management and maximizing profits.
Bounce trade entry using direct market order
Open a direct sell market order at a resistance level when price is expected to reverse and turn around instantly to the downside.
Open a direct buy market order at a support level when price is expected to reverse and turn around instantly to the upside.
Bounce trade entry using limit order
Assume price is heading for a high probable resistant level.
Place a sell limit order at that level with a defined stop loss.
Assume price is heading for a high probable support level.
Place a buy limit order at that level with a defined stop loss.
Bounce trade entry using fractals
For proper understanding on how to use fractals, read the comprehensive article on forex fractal strategy.
Whenever price movement is at any significant support or resistance level.
Wait for a fractal high to confirm and validate a decline in price movement from the resistance level.
Wait for a fractal low to confirm and validate a rally in price movement from the support level.
Open a long market order at the break of the high of the 4th candle of the bullish fractal and place stop loss at the bottom of the fractal.
Open a short market order at the break of the low of the 4th candle of the bearish fractal and place stop loss at the top of the fractal.
Note: As always there is high risk in trading so practice on a demo account until your win to loss ratio is greatly improved before trading with live funds.
With this counsel taken seriously on bounce forex strategy, a successful trading career is guaranteed.
Click on the button below to Download our "Bounce forex strategy" Guide in PDF
