Ichimoku Cloud Trading Strategy
It is no doubt that the Japanese have contributed tremendous impact and innovation to the financial market trading industry with the design of creative tools that make all forms of trading, investing, technical and fundamental analysis of all assets in the financial market easier and better for traders, investors and technical analysts. Not only did they invent the famous and most widely used Japanese candlestick charts which can be plotted on any tradable financial assets, among the indicators that they have created is a highly versatile and comprehensive indicator known as Ichimoku cloud.
Ichimoku cloud is known by the Japanese as "Ichimoku Kinko Hyo" which means "an equilibrium chart in one glance".
The Ichimoku cloud was developed in the 1930s by a Japanese journalist known as Gocchi Hosada. Not until after three decades of development and perfection, Gocchi released the indicator to the mainstream world of traders in the 1960s. His efforts to perfect the Ichimoku cloud indicator put the indicator in the rank of one of the most popular technical analytical tools among financial market traders, technical analysts, financial market analysts and investors of all kinds such that it can be found on the indicator section of various trading platforms.
The Ichimoku cloud indicator primarily serves as a momentum-based trend-following indicator used to highlight probable trading opportunities in an established trending market by its ability to highlight dynamic price levels of support and resistance.
The components of the Ichimoku cloud indicator
The Ichimoku cloud indicator has 5 lines which are the derivatives of 3 different moving averages. These five (5) lines are overlayed on the price chart over price movement but two (2) of the five (5) lines form the cloud which is usually either above or below price movement. When plotted over the price chart, they may seem chaotic, uneasy and messy to a trader that is newly introduced to the Ichimoku cloud indicator but it has a lot of clarity and meaning to a seasoned Ichimoku cloud trader.
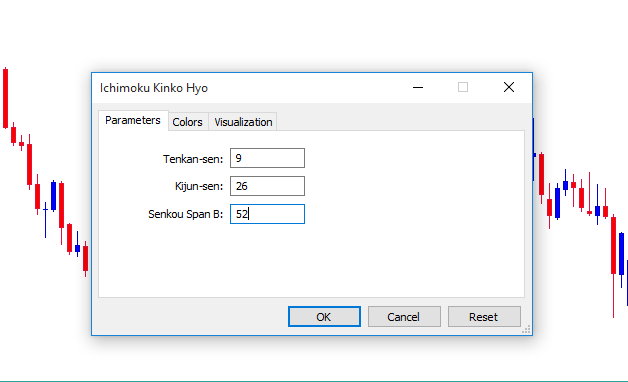
The input parameter setting of the Ichimoku Cloud indicator
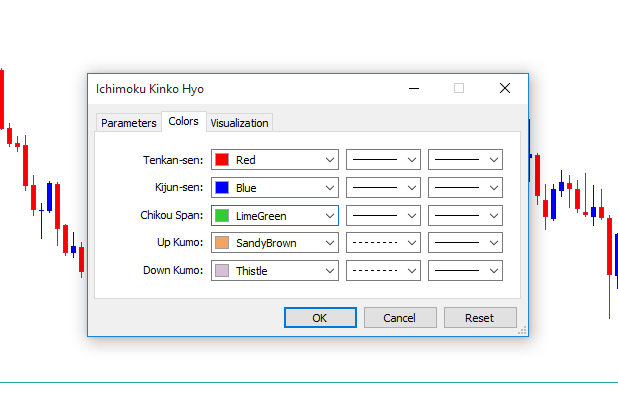
The line color setting of the Ichimoku Cloud indicator
The default input parameter of the Ichimoku cloud that makes up the 3 important lines and the boundaries of the expanding and contracting cloud are 9, 26, 52.
The three lines differentiated by colours have their different meanings and functions.
The red coloured line of the indicator is the conversion line known as “Tenkan Sen”. The line is derived by the average price data of each candlesticks’ highs and lows within a lookback period of 9 candlesticks or bars on any timeframe.
The blue coloured line of the indicator is the baseline also known as “Kijun Sun”. The plotted line is derived by the average price data of each candlestick’s highs and lows within a lookback period of 26 candlesticks or bars on any timeframe.
The green coloured line of the indicator known as the “Chikou Span” calculates the average of the closing prices in a lookback period of 26 candlesticks or bars on any timeframe.
The cloud is enclosed by two lines known as “Senkou Span A and Senkou Span B”.
- Senkou Span A: the upper line of the cloud is the average value of the sum of Tenkan Sen and Kijun Sen.
- Senkou Span B: the lower line of the cloud is derived by the average price data of the highs and the lows in a lookback period of 52 candlesticks or bars on any timeframe.
How to perform technical analysis with the Ichimoku Cloud Indicator
When performing technical analysis using the Ichimoku cloud indicator, a professional Ichimoku based trader and technical analyst always begin his or her analysis and trading plan with the information derived from the cloud.
Beginning with the cloud: The market is considered to be bullish when the cloud is green and considered to be in an uptrend when the price movement is above the cloud i.e. supported by the cloud. On the other hand, the market is considered to be bearish when the cloud is red and also considered to be in a downtrend when price movement is below the cloud i.e resisted by the cloud.
In addition, the wider the boundary lines of the cloud towards a particular direction indicates high volatility of price movement towards that direction.
The more narrow the boundary lines of the cloud towards any direction indicates poor volatility and price movement in a tight range or consolidation.
The green line is known as the “Chikou Span”. It can also be used for additional confluence in a trend direction. For instance, If the cloud is green and supports price movement in an uptrend. Whenever the green line crosses price movement in a bottom-up direction and is in confluence with the bullish idea of the cloud. The odds of further price extension to the upside increases. Conversely, If the cloud is red and acts as resistance to price movement in a downtrend. Whenever the green line crosses price movement in a top-down direction and is in confluence with the bearish idea of the cloud. The odds of further price extension to the downside increases.
Another very important factor is the crossover between the baseline (Kijun San) and the red line (Tenkan Sun). Whenever all these confluences are aligned towards a particular direction, to the well-trained Ichimoku trader it implies momentum and strength of price movement towards that direction, therefore trade setups will be anticipated only in that directional bias.
Ichimoku cloud trading strategies: How to frame high probable trade setups on any currency pair
The Ichimoku cloud indicator can be used as a standalone indicator for trending markets because of its comprehensive analytics of the market behaviour of price movement in an uptrend or downtrend.
Other tools can be added to complement the trade ideas and signals provided by the Ichimoku cloud and then the confluences with these other tools can be used to frame low risk and high probable trade setups. The indicator works on all timeframes with its default input parameter as well as it is effective for all types of trading like position trading, long term trading, short term trading, day trading and scalping.
The multiple lines of the indicator (including the cloud) are high probable levels of dynamic support when price movement is in an uptrend and dynamic resistance when price movement is in a downtrend.
There must be a concise trading plan or strategy that leads to precise and accurate buy and sell signals.
Ichimoku cloud trading plan for buy setup
To anticipate and frame high odds bullish trade setups on the indicator dynamic levels of support (the baseline, the conversion line and the cloud).
The Ichimoku cloud indicator must have confirmed a bullish directional bias of that asset by
- First, identify that price movement have crossed above the conversion line and the baseline.
- Next, ensure that the Ichimoku cloud appears green and widening after a bullish crossover of the Senkou Span lines.
Example of Ichimoku cloud bullish trade setups on GBPUSD 4Hr Chart
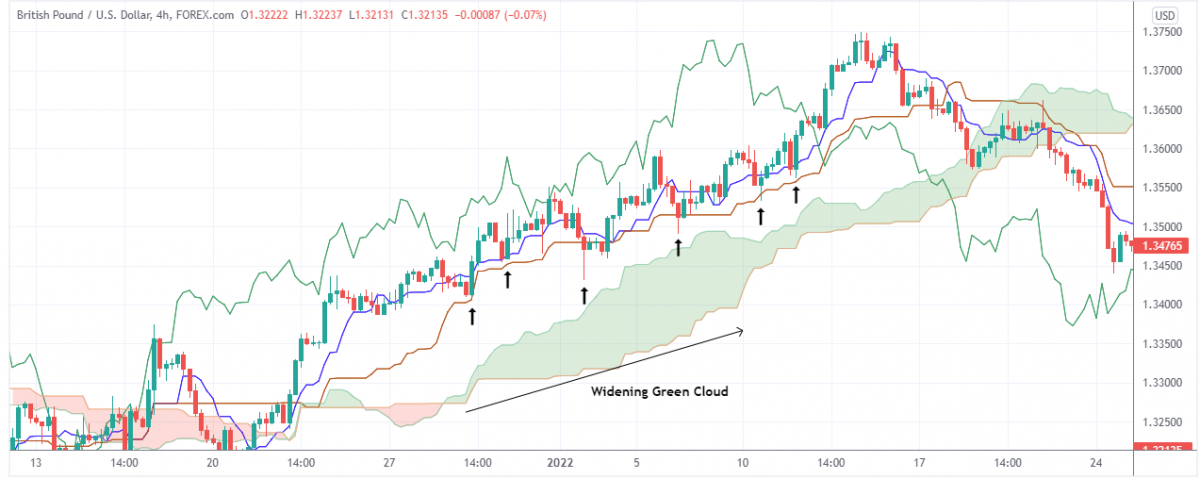
On the GBPUSD 4hr chart, we can identify the bottom-up cross of the green line “Chikou Span” over price movement. We can also identify price movement above the blue coloured line (baseline) and the red coloured line (conversion line), then the widening of the Senkou Span A and B crossover (i.e the widening green cloud). These are all the conditions needed to be met to increase the odds of a profitable trade idea hence multiple bullish trade setups can be identified as dynamic support on both the baseline and the conversion line.
Ichimoku cloud trading plan for sell setup
To anticipate and frame high odds bearish trade setups on the indicator dynamic resistance levels (the baseline, the conversion line and the cloud).
The Ichimoku cloud indicator must have confirmed a bearish directional bias of that asset by
- First, identify that price movement have crossed below the conversion line and the baseline.
- Next, ensure that the Ichimoku cloud appears red and widening after a bearish crossover of the Senkou Span lines.
Example of Ichimoku cloud bearish trade setups on USDX Daily Chart
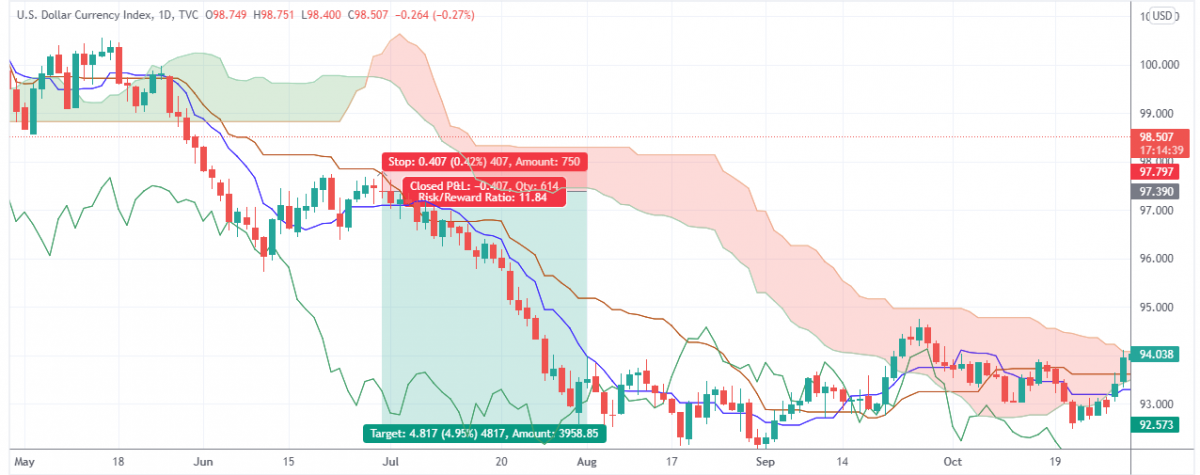
This is a classic example of a bearish long term trade setup on the Usdx daily chart. We can identify the top-down cross of the green line “Chikou Span” over price movement. We can also identify price movement below the blue coloured baseline line (Kijun Sun) and the red coloured conversion line (Tenkan Sen), then the widening of the Senkou Span A and B crossover (i.e the widening green cloud) in a bearish direction.
The duration of the bearish position trade (a large impulsive sell-off covering a range of more than 400 pips) from its entry to exit was between the 1st of July to the 31st of July 2020, a period of one month.
Conclusion
Although Ichimoku cloud indicator is a great tool for technical analysis of various financial market assets. The strength of the indicator lies in its ability to identify a sustainable trend and also frame high odd setups in a trending market. Therefore it can tell the difference between a trending market from a non-trending market but its signals are usually weak and quite inapplicable in non-trending, consolidating markets.
Click on the button below to Download our "Ichimoku Cloud Trading Strategy" Guide in PDF
