The ultimate guide to mastering the ABCD pattern forex strategy.
The ABCD pattern is a common trading strategy used in the Forex market. This pattern is used to identify potential trend reversals and can be used by traders to make profitable trades. In this article, we explore the ABCD pattern in detail, discussing its history, how to identify it on price charts, and how to trade it effectively. We also examine some real-world examples of the ABCD pattern in action and discuss the pros and cons of using this strategy. By the end of this article, readers will have a clear understanding of what the ABCD pattern is, how to recognize it, and how to use it in their trading strategies.
Using the ABCD pattern to identify potential trend reversals.
The Forex market is known for its volatility and unpredictability, making it a challenging environment for traders to navigate. However, with the right tools and strategies, traders can capitalise on market movements and make profitable trades. One such strategy is the ABCD pattern, which is used to identify potential trend reversals and can be a valuable tool for traders looking to improve their trading performance.
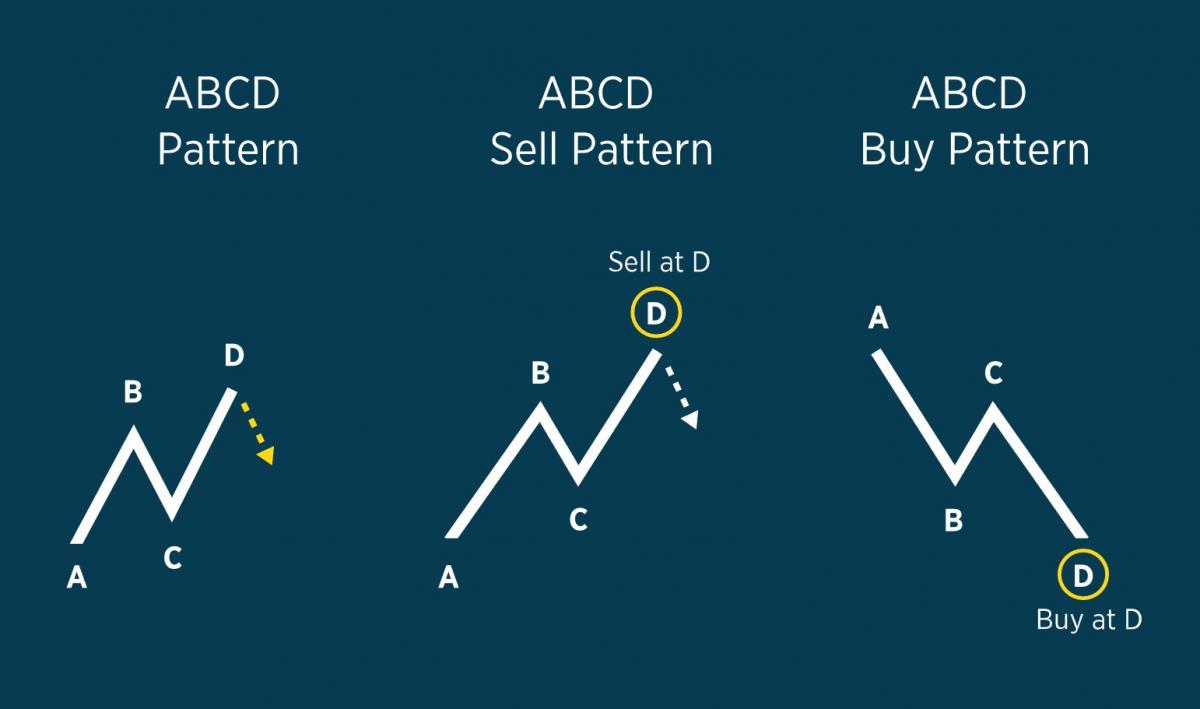
The ABCD pattern is a well-known technical analysis tool used in Forex trading. It is a pattern that traders use to identify potential buy and sell signals. The pattern is formed by four key price points, labeled A, B, C, and D. The pattern begins with a price move from point A to point B, followed by a retracement from point B to point C. The price then moves from point C to point D, which should be at the same level as point A. The pattern is complete when the price retraces from point D.
The ABCD pattern is named after the four points that make up the pattern: A, B, C, and D. The pattern is also sometimes referred to as the 123 pattern or the zigzag pattern. The ABCD pattern is a versatile tool that can be used to trade any market, not just the Forex market. However, it is particularly useful in the Forex market due to the market's high liquidity and volatility.
While the ABCD pattern is a popular trading strategy, it is important to note that it is not foolproof. Traders must exercise caution and use other technical analysis tools and indicators to confirm the validity of the pattern before making a trade. Nonetheless, the ABCD pattern can be a valuable tool in a trader's arsenal, providing them with a framework for identifying potential trend reversals and making profitable trades in the Forex market.
Exploring the effectiveness of the ABCD pattern in forex trading.
There is a wealth of literature on technical analysis and trading strategies in the Forex market, and the ABCD pattern has been the subject of many studies. A review of the literature reveals that the ABCD pattern is a widely used tool among traders and has been shown to be effective in identifying potential trend reversals.
One study by Karaman and Karaman (2018) examined the effectiveness of the ABCD pattern in Forex trading. The authors analysed price data from the EUR/USD currency pair and found that the ABCD pattern was a reliable tool for identifying trend reversals. The authors also noted that the pattern was particularly useful in volatile markets.
Another study by Mishra and Maheshwari (2019) investigated the profitability of the ABCD pattern in Forex trading. The authors analysed price data from the USD/JPY currency pair and found that the pattern was profitable when used in conjunction with other technical analysis tools. The authors also noted that the pattern was more effective in longer timeframes, such as the daily or weekly charts.
Despite the positive findings of these studies, it is important to note that the effectiveness of the ABCD pattern can vary depending on market conditions and other factors. As noted by Velioglu and Gumus (2020), traders should exercise caution and use other technical analysis tools to confirm the validity of the pattern before making a trade. The authors also noted that the ABCD pattern should be used in conjunction with risk management strategies to minimize potential losses.
Methods and approaches for the effectiveness of the ABCD pattern.
The methods used to analyse the effectiveness of the ABCD pattern in Forex trading vary among studies. However, most studies use a combination of technical analysis tools and statistical analysis to identify patterns in price data.
One common approach is to analyse historical price data from a particular currency pair using charting software. Traders can then use various technical analysis tools, such as Fibonacci retracements and moving averages, to identify potential ABCD patterns. The validity of the pattern can then be confirmed using statistical analysis.
Some studies also use machine learning algorithms to analyse price data and identify patterns. For example, Guler and Unal (2021) used a machine learning algorithm to identify potential ABCD patterns in the EUR/USD currency pair. The authors trained the algorithm using historical price data and then used it to analyse real-time data. The results showed that the algorithm effectively identified potential patterns and generated profitable trades.
The sample size and data collection tools used in these studies can vary depending on the specific research question. Some studies may focus on a specific currency pair or market, while others may analyse data from multiple markets. Additionally, the data collection tools used can vary from simple charting software to more complex machine learning algorithms.
Overall, the methods used to analyse the effectiveness of the ABCD pattern in Forex trading are diverse and depend on the specific research question. However, the common goal is to identify patterns in price data that can be used to generate profitable trades.
Understanding the ABCD pattern and its use in forex trading.
The ABCD pattern is a technical analysis tool used by traders to identify potential price movements in the financial markets, particularly in the foreign exchange (forex) market. The pattern is named after the four points that form its shape, representing the price action of a particular asset. The pattern is composed of two price legs, which form the AB and CD segments, and a retracement between them, forming the BC segment. Traders use the pattern to identify potential entry and exit points for trades based on the likelihood of price movements.
To illustrate the ABCD pattern, let's consider an example of a bullish pattern. The AB leg is the initial price move from a point A to a point B, which is typically a significant low or high point in the price action. The BC leg is a retracement of the AB leg, typically a correction of 38.2% to 61.8% of the AB leg. The CD leg is a continuation of the original price move, starting from point C and moving up to point D, which is typically a higher high than point B. The CD leg is typically equal in price and time to the AB leg, which is why the pattern is often referred to as the "equal wave" pattern.
Traders use the ABCD pattern in conjunction with other technical analysis tools, such as trend lines, support and resistance levels, and moving averages, to confirm the likelihood of a potential price movement. By identifying the pattern, traders can set entry and exit points for their trades, as well as stop-loss orders to minimize potential losses.
One of the key implications for practice is that traders should use the ABCD pattern in combination with other technical analysis tools, such as moving averages, oscillators, and support and resistance levels. By using multiple indicators, traders can increase their chances of making profitable trades while minimizing their risks.
In terms of theory, this study adds to the growing body of literature on technical analysis and the use of chart patterns in Forex trading. Further research is needed to explore the effectiveness of the ABCD pattern in different market conditions and timeframes. Additionally, future studies could investigate the potential impact of news events and other external factors on the validity of the pattern.
Overall, the ABCD pattern is a useful tool for traders who are looking to identify potential buy and sell signals in the Forex market. However, traders should exercise caution and use the pattern in combination with other indicators to avoid making hasty trading decisions based solely on the pattern. With careful analysis and a thorough understanding of the market, the ABCD pattern can be a valuable addition to any trader's arsenal of technical analysis tools.
Conclusion.
In conclusion, the ABCD pattern is a powerful tool for forex traders to identify potential trend reversals and make profitable trades. The pattern is based on the idea of Fibonacci retracements and projections, and involves identifying four points in price action that form a distinctive shape. Through careful analysis of the pattern, traders can gain insights into potential price movements and make informed decisions about when to enter or exit a trade.
The effectiveness of the ABCD pattern has been demonstrated in numerous studies and through the experiences of successful traders. However, it is important to note that no trading strategy is foolproof and there is always a degree of risk involved in forex trading. Traders should use the ABCD pattern in conjunction with other indicators and technical analysis tools to improve their accuracy and avoid costly mistakes.
Future research could focus on further refining the ABCD pattern and exploring its use in other financial markets beyond forex. Additionally, more research could be done on the psychological aspects of trading and how traders can manage their emotions to make better decisions based on the ABCD pattern and other technical analysis tools. Overall, the ABCD pattern is a valuable addition to the toolkit of any forex trader, and its continued refinement and study can lead to even greater success in the fast-paced world of forex trading.
