What is market cycle in forex trading
All aspects of life (time, business, weather, seasons e.t.c) all revolve around cycles, and there are also cycles that are found in the financial markets often referred to as market cycles. The concept of market cycles refers to the phases of price movement that are usually repetitive, with each having its own set of characteristics. To both long and short-term traders, it is vital to understand the market cycles that revolve around the financial markets.
This is useful for traders since it allows them to profit from price movements in any asset class, including stocks, cryptocurrencies, commodities, currencies, etc. The importance of market cycles is emphasized even further for traders of derivatives, like CFDs, as it allows them to profit from both bullish and bearish price movements. While price movements may appear to move randomly up and down, they actually have distinct characteristics that are influenced by market factors such as high-impact news releases, monetary policies, easing cycles and greed at fresh market highs and lows.
A common problem faced by market participants is they either don't know or don't have the experience to spot the phases of a market cycle, which results in difficulty picking the right direction of price movement. Traders can also experience frustration and incur losses when they seek to profit from extreme market highs and lows. How can traders spot cycles in price movement and know when the price movement of an asset is likely to change from one phase to another?
In this article, we’ll provide an in-depth explanation of different market cycles and show you what you need to know to be among the top 1% of sophisticated investors and profitable traders. By understanding these market cycles, traders and investors are equipped with vast knowledge to make better trading decisions and significantly improve their profitability.
Types of market cycles
Market cycles come in variations, and this section provides an overview of the most prevalent market cycles. In addition, helpful hints on how to spot these phases of price movement and profit from them will also be addressed.
- Wyckoff market cycle
As we have discussed above, just as economies experience cycles of boom and recession, financial market cycles are also characterized by phases.
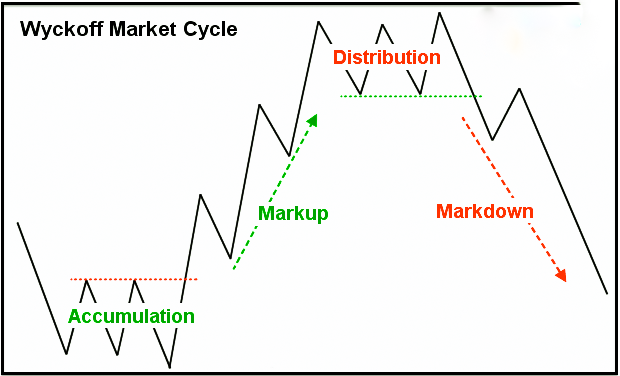
Phases of the Wyckoff market cycle are described as follows;
Accumulation / expansion phase: Expansion occurs due to economic growth and results in a bull market. It is during this phase that investors and traders can profit from a long trade position. In a well-managed economy, this phase can last for years
Markup / peak phase: This is when buying pressure reaches its peak and smart money starts to offset its long positions on highly-priced assets leading to a contraction or distribution phase.
Contraction / distribution phase: The distribution phase of the wyckoff cycle marks a period of market decline, beginning at a peak and ending at a trough. During this period, economists refer to the market as being in a recession.
Trough / markdown: At this point, the market has sunk to its lowest troughs and smart money may have offset all their short positions which will cause the market to consolidate or begin another market cycle.
- The Forex Market Cycle
The Wyckoff market cycle can be applied to any market, given its foundation in investment psychology, but there are cycles that are unique to specific asset classes. A popular forex market cycle is the tightening and easing cycle of central banks. Several similarities can be drawn between this cycle and the cycle of an economy.
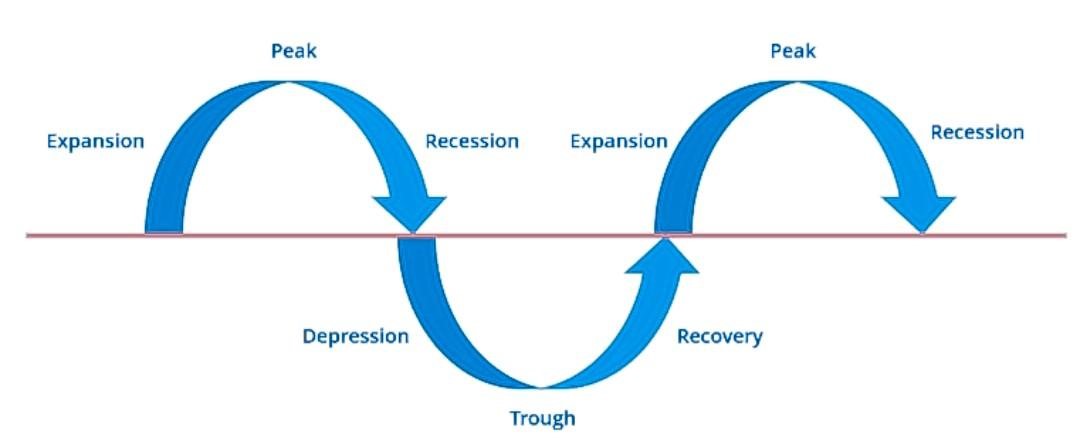
During the expansionary phase of an economy, stock markets begin to recover from the most recent market troughs and economic indicators begin to improve indicating a boom for the economy. This phase is characterized by a very loose monetary policy where central banks lower interest rates during recessions in order to stimulate economic activities and make borrowing cheaper. This in turn increases consumers purchasing power and the ability for companies to invest in new business facilities. Stock markets prices then begin to rise again similar to the mark-up phase of the Wyckoff cycle and investors begin buying stocks again, which further accelerates a bull run.
- The Wall Street Market Cycle
Another commonly observed market cycle is the Wall Street market cycle which is closely related to the Wyckoff market cycle. It breaks down the four Wyckoff phases into details that are more connected with the stock market and how investors react in each of these phases.
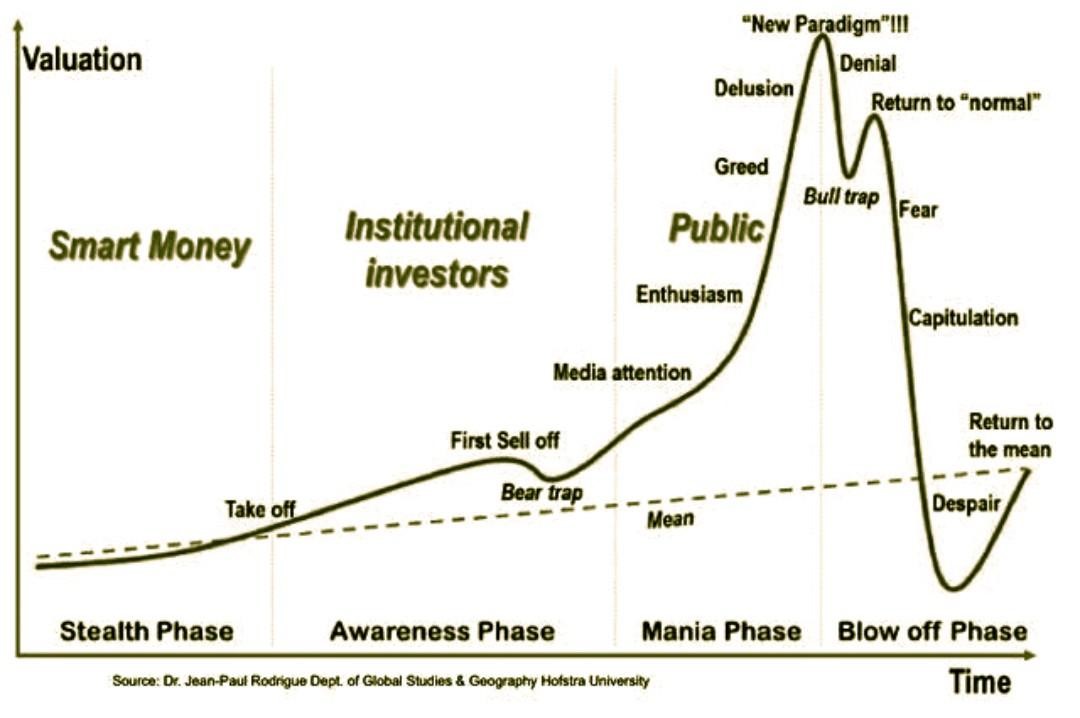
The cycle does commence with the stealth phase, a metaphor for rising stock prices in an early uptrend which has similar characteristics to the accumulation phase of the Wyckoff cycle. During the stealth phase, this is where smart money accumulates long positions inducing a rally in stock prices, thus presenting an opportunity for sophisticated investors and stock traders to scout excellent long positions based on extremely cheap valuations with the idea that the troughs in the market are over. This is usually the longest phase, characterized by slowly rising prices as less informed and novice investors continue to sell. As the market recovers from the bottom, the awareness phase begins where smart money offset a little of their long holdings thus creating a small correction of the rally, called the bear trap. But the bull market continues to get tractions, forming fresh higher highs. At this point, the financial media begins to highlight these new opportunities in the stock market, attracting more retail investors and accelerating the bull market. This phase is known as the mania phase. This is where enthusiasm replaces fear which was the predominant sentiment when the market was at its lows. And not too long, it quickly turns into greed, and then greed into delusion. Smart money and sophisticated investors start to exit their long positions at the extreme highs, causing a correction lower in price movement. This is known as the bull trap because less informed investors perceive the lower correction as an excellent buying opportunity to add to their existing long positions. However, at this phase where selling pressure outweighs the buying pressure, prices continue to fall drastically, leading to panic and despair thus resulting in what is called the blow-off phase, usually the most abrupt phase of the four and the most traumatic experience to less informed traders and investors.
What Are the Drivers of Market Cycles?
A number of factors can cause the market to go through booms and busts, with investors scrambling to buy specific assets or panicking and shorting in large amounts. There are several reasons for the cycles in the financial markets; Chief among them is the interest rate being the number one driving force of the financial market and other macroeconomic factors including inflation, economic growth rates and unemployment rate.
It is also obvious how market sentiment plays an integral role in the phases of the market cycle. When there is a drop in interest rates, it is perceived to indicate economic growth which will send market prices higher. Inflation often precedes an increase in interest rates which can cause market contraction and a slowdown in economic growth.
Historical examples of market cycle
The history of the financial markets is replete with examples of market cycles. For instance, in the 1990s, there was an unprecedented boom in spending and productivity, which led to the rise of the baby boomer generation and the rise of the stock markets. The introduction of new technologies, such as the Internet, were accompanied by low interest rates and a high level of debt. At the turn of the century, interest rates increased sixfold, which ultimately led to the dot-com bubble burst and a mini-recession until the 2007 bubble when the market rose again. Since then, the have been subsequent market bubble and burst.
Analyzing market cycles of the financial market
All experienced traders have methods that they use to analyse the different phases of a market cycle. Many traders use the Elliott wave principle to analyze price movement and Scout trade setups. This Elliott wave analysis concept is based on the principle that “every action creates an equal and opposite reaction.” This means that the direction of an asset’s price movement is dependent on external market factors and sentiment.
What are some indicators used to spot market cycles?
In technical analysis, indicators are used to analyze almost everything, including market cycles. Among these indicators are the Commodity Channel Index (CCI) and the Detrend Price Oscillator (DPO). When analyzing the cyclical nature of an asset, both indicators can be very useful. The CCI was developed specifically for the commodity markets but it is equally useful for analysing stocks and CFDs. The DPO works without the trend of price movement, making it easier to identify cyclic highs and lows as well as overbought and oversold levels.
Summary
Throughout history, all markets have followed a circular pattern, which means that market cycles are repetitive in nature. When a cycle ends, its last phase usually marks the beginning of a new one. Market cycles and their different phases are invaluable resources for investors and traders who wish to avoid trading in the wrong direction of any financial asset. Short-term traders can also benefit from market cycles by trading market corrections and pullbacks during expansionary phases.
