What is Price Action in Forex?
Probably, you have heard the term "price action" in your day-to-day trading activity, but for some, it can be like solving complex algebraic equations. Don't fuss; as in this guide, we are going to hone in on what is price action in forex. So, if you are a beginner, you'll find this guide interesting.
What does Price Action mean?
When you think of price action, it feels like price is battling in a war. This is exactly what price action is. It denotes the movements of a currency pair.
When a technical trader talks about price action, he/she is talking about the day-to-day changes in the price of a particular currency pair. For instance, if the EUR/USD changes from 1.1870 to 1.1900, the price has changed to 30 pips.
In the forex market or other financial markets, price action is part of technical analysis.
Technical analysis is a trading method that uses data from trading activity, such as price change and volume, to forecast future market movement.
By analyzing the price movement over a specific period, you get all the info you need to trade trends, breakouts, and swings effectively.
What forex price action tells you?
Price action is seen and analyzed using charts that depict prices over time. You can use different charting techniques to improve your chances of spotting breakouts and reversals.
You can spot price action using candlestick charts, as they help better picture price movements by illustrating the open, high, low, and close price values.
We'll discuss many price action tools later.
Candlestick patterns such as the engulfing pattern, pin bar pattern, morning star pattern, harami cross are all described as visual interpretations of price action.
There are many other candlestick patterns that the price action generates to forecast future expectations. You can also see price action in action on line and bar charts.
Besides visual price representation, you can use price action data when calculating technical indicators to find random price fluctuations.
An ascending triangle pattern formed by adding trendlines to a price action map, for example, can be used to forecast a possible breakout since the price action shows that bulls have attempted a breakout many times and gained traction each time.
Price action trading tools
To be able to interpret price action, you need some tools. I am not talking about hammer and sickle, but technical analysis tools. The preferred tools for price action are breakouts, trends, and candlesticks. We mentioned candlesticks before in the above section; here, we'll explain them in detail. Preferred tools for traders are breakouts, candlesticks, support and resistance, and trends.
1. Breakout
A breakout occurs when the price of a pair changes its direction, presenting traders with new opportunities.
For example, assume GBP/USD was trading between 1.350 and 1.400, but today it started moving above 1.400. This change will alert many traders that indecision has ended, and now price can go beyond 1.400.
Breakouts pop up from different patterns like flag pattern, triangle pattern, head and shoulders pattern, and wedge pattern.
A keynote to add here is that a breakout doesn't mean the price will continue moving in the same direction. This is called a false breakout, and it presents a trading opportunity opposite to the direction of a breakout.
2. Candlesticks
Candlesticks are graphical depictions on a chart that show the trend, open, close, high, and low price of a currency pair. For instance, a small body on top of a large lower shadow signifies the hanging man pattern.
Candlesticks are interesting price action tools, as they show potential price movements and present exact entry and exit points.
3. Trends
A pair can go up and down throughout the trading day. When the price climbs up, it is called a bullish trend, and when the price falls, it is known as a bearish trend.
4. Support and Resistance
Support and resistance provide excellent trading opportunities. This is because when the price action is at a particular level, there is a chance that it will come to this level again in the future.
Price action trading
Now that you know what price action in forex is and some of the tools you can use to interpret price action, it's time to move to the juicy part; price action trading and its strategies.
Traders make their decisions based on the price fluctuations of a currency pair. This is the essence of forex price action trading; to follow the movement of prices and trade at the most profitable moment.
Most forex price action traders don't use technical indicators such as Bollinger bands or moving averages, but if you do want to combine these indicators with price action, you should not completely rely on these indicators. This is because, as a price action trader, you should look at the movement of the price itself and not what indicators are telling you.
Swing traders and trend traders work more closely with price action. Even in this situation, you must pay attention to other factors beyond the current price, such as the volume of trading and the desired time period.
If a currency pair's price jumps up, it shows that traders are buying because the price rises as traders buy. You then assess the price action based on buying behavior and go through historical charts and real-time analysis such as trading volume.
Price action trading strategies
There are many forex price action trading strategies you can apply. Some of them are:
- Inside bar after a breakout
- Hammer pattern
- Hanging man pattern
1. Inside bar strategy
Inside bars after breakout signifies to the bar in a candlestick pattern between the previous bar's range after a breakout occurs. The previous bar, the bar before the inside bar, is often referred to as the "mother bar."
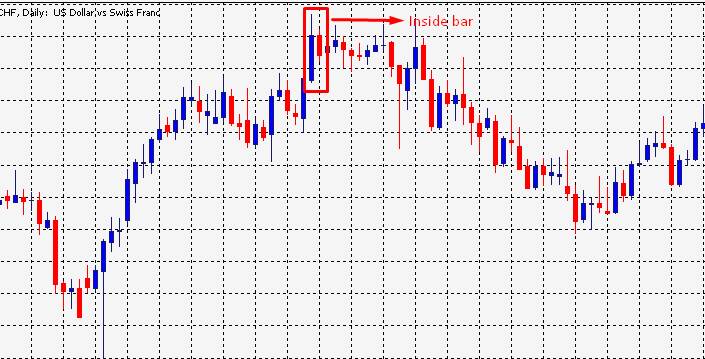
Inside bar on a chart
Inside bars can be traded in the direction of the trend. They can also be traded counter-trend, usually from key chart levels, and are known as inside bar reversals when doing so.
The typical entry for an inside bar signal is to place a buy or sell entry point at the high or low of the mother bar and then fill your entry order when the price breaks above or below the mother bar.
If the mother bar is larger than normal, the stop loss is usually located at the opposite end of the mother bar or at the mother bar halfway point (50 percent level).
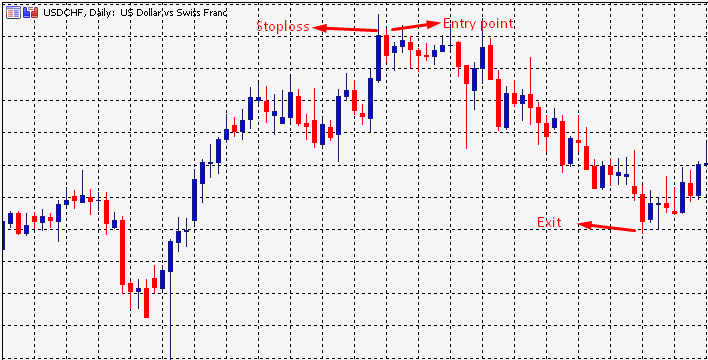
Inside bar trading strategy
2. Hammer pattern
The hammer is a candlestick with a hammer-like appearance. Since the open, near, and high are all close together, and the low is long, it takes on the form of a hammer handle. Traders consider hammers to be a trend reversal. It can either be a bullish or a bearish reversal.
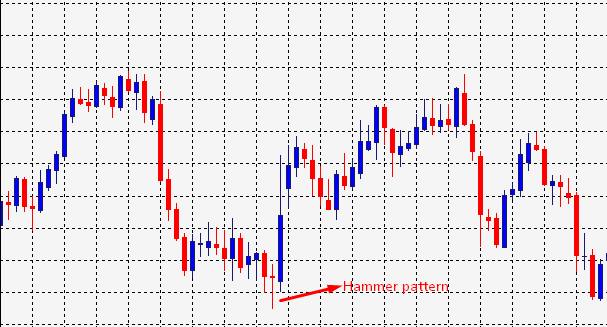
Hammer pattern on a chart
To trade the pattern, enter on the confirmation candle. Confirmation came on the next candle, which closes above the hammer's closing price.
You need to enter at the confirmation candle. This is because sometimes the pattern can present false breakouts. A stop-loss can be placed below the hammer's low or at the recent low.
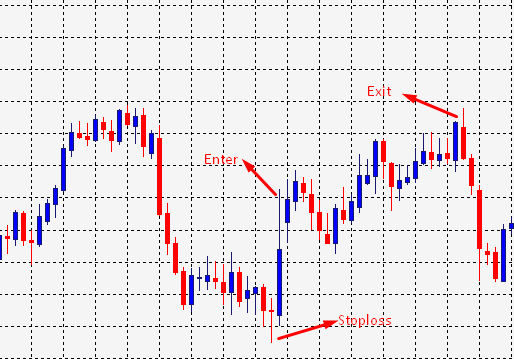
Hammer pattern trading strategy
3. Hanging man pattern
To trade the hanging man pattern, bear a few things in mind: first, the volume should be higher, and second, the long lower shadow should be accompanied by downward momentum. You can only take trading positions if the trend meets these rules.
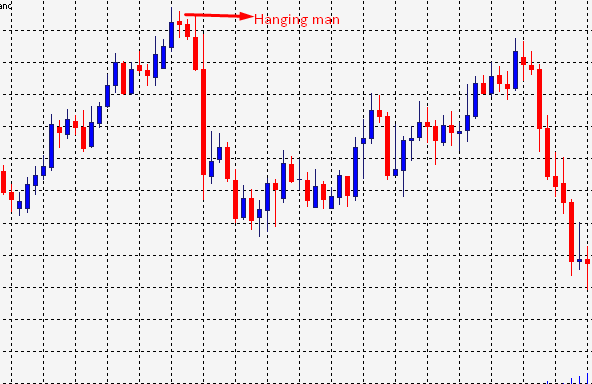
Hanging man pattern on a chart
You can start a short position on the next candle of the hanging man pattern, or you can exit your long positions once you've identified a pattern.
You should take short positions on the hanging man candle instead of the next candle if you are an aggressive trader. You can set your stop-loss near the hanging man pattern's recent high and your take-profits near the pattern's recent low.
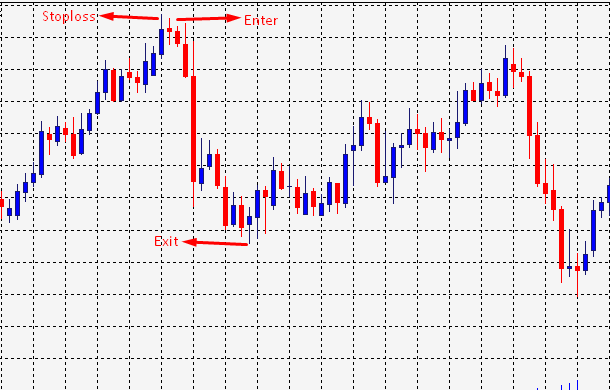
Hanging man pattern trading strategy
Can you predict forex price action?
After learning about price action trading, you'd be pondering I can accurately predict a forex price action?
The simple answer is "no."
Let us explain.
Some traders assume that they can completely predict price action if they have enough experience in the forex market.
After all, it's safe to believe that if you've spent years in front of a computer and spent gazillion hours honing your technical analysis skills, you know the markets like the back of your hand.
But, this type of presumption is risky because nobody, not even the best traders, can come with 100% accurate predictions for price action.
Pros and Cons of price action
Pros
- You don't need a lot of research.
- It can present you with profitable entry and exit points.
- You can apply whichever strategy you want.
Cons
- When two traders analyze the same price behavior, it's common for them to come to contradictory opinions.
- The past price action of security is no guarantee of future price action.
Bottom line
All new traders can take advantage of learning price action trading. By learning to read and interpret price chart movements, you can develop your own trading system. One thing you need to remember is price action trading doesn't guarantee profits, but it makes an excellent trading methodology with time and practice.
Click on the button below to Download our "What is Price Action in Forex?" Guide in PDF
