How to read Forex charts
In the trading world of Forex, you must learn the charts first before you can begin trades. It is the basis on which most exchange rates and analysis forecasting is done and that is why it is a trader’s most important tool. On the Forex chart, you will see the differences in currencies and their exchange rates and how the current price alters with time. These prices range from GBP/JPY (British pounds to Japanese yen) to EUR/USD (Euros to US Dollars) and other currency pairs you can view.
A Forex Chart is defined as a visual illustration of the price of paired currencies over a particular time frame.
It pictures the activity of trades going on for the duration of a particular trading period notwithstanding the duration whether in minutes, hours, days or even weeks. The change in price occurs at a random time when no one can expect exactly so as traders, we should be able to handle the risks of such trades and make probabilities and this is where you will need the chart's assistance.
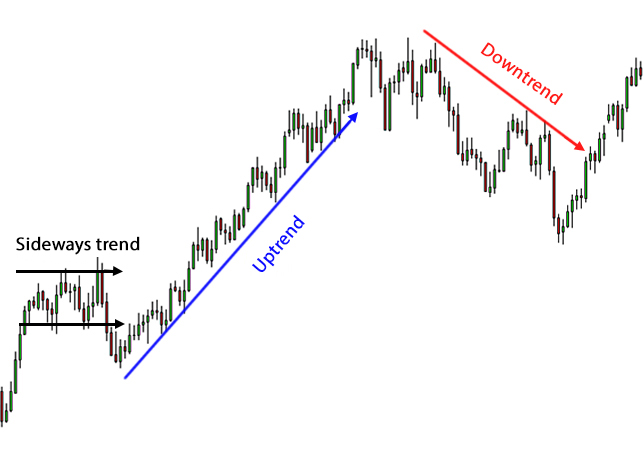
It is very easy to make use of charts as you can get a grasp of the changes in prices by just looking at them. On the chart, you will see how various currencies move and you can ascertain the tendency of going up or down at a particular time. It has to do with the two axes and the y-axis is on the vertical side, and it stands for the price scale while the time is depicted on the horizontal side which is the x-axis.
In the past, people used hands to draw charts but nowadays, there is software that can plot them from left to right across the x-axis.
How the price chart functions
A price chart shows variations in demand and supply and it totals each of your trading transactions at all times. There are various news items you will find in the chart and this includes future news and expectations too which help traders adjust their prices. However, the news might be different from what comes in the future, and at this time, the traders will make further adjustments too and shift their prices. This goes on and on as the cycle goes on.
Whether the activities are coming from numerous algorithms or humans, the chart blends them. It is in this same way you will find different information on the chart either from an exporter, central bank, AI, or even retail traders as regards their transactions.
The different types of Forex charts
There are various types of charts in Forex but the most used and renowned are the line charts, bar charts, and candlestick charts.
Line charts
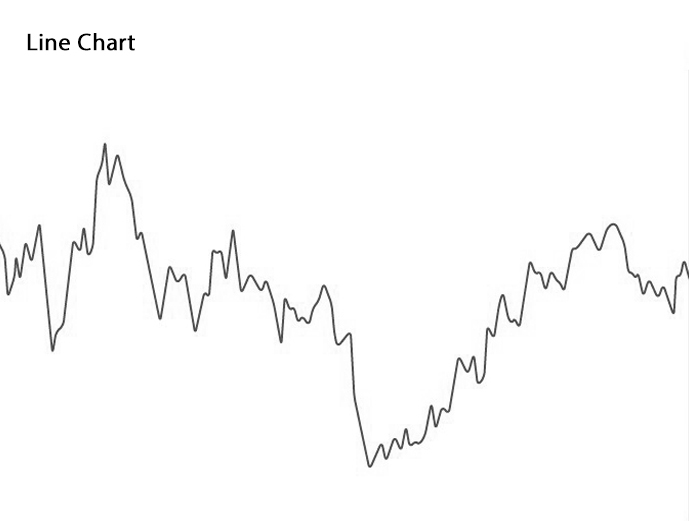
The Line chart is the easiest of all. It draws a line to join closing prices and in this way, it portrays the rising and falling of paired currencies with time. Even though it is easy to follow, it does not give traders enough information on the behavior’s of prices. You will only find out after the period that the price ended at X and nothing more.
However, it aids you in easily viewing trends and making comparisons with closing prices of different periods. With the line chart, you can get an overview of the movement in prices just like in the EUR/USD example below.
Bar charts
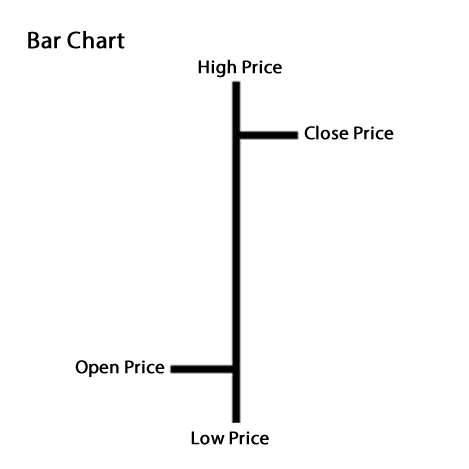
In comparison to the line chart, bar charts are quite complicated though it surpasses line in providing sufficient details. Bar charts also provide a view of opening, closing, high and low prices of pairs of currencies. At the bottom of the vertical axis which stands for the general trade range for the currency pair, you will find the lowest trade price at that time while the highest is at the top.
The horizontal hash shows the opening price on the left side of the bar chart and the closing price on the right side.
With increased volatility in price fluctuations, the bars enlarge while they decrease when the fluctuations are stiller. These fluctuations are due to the construction pattern of the bar.
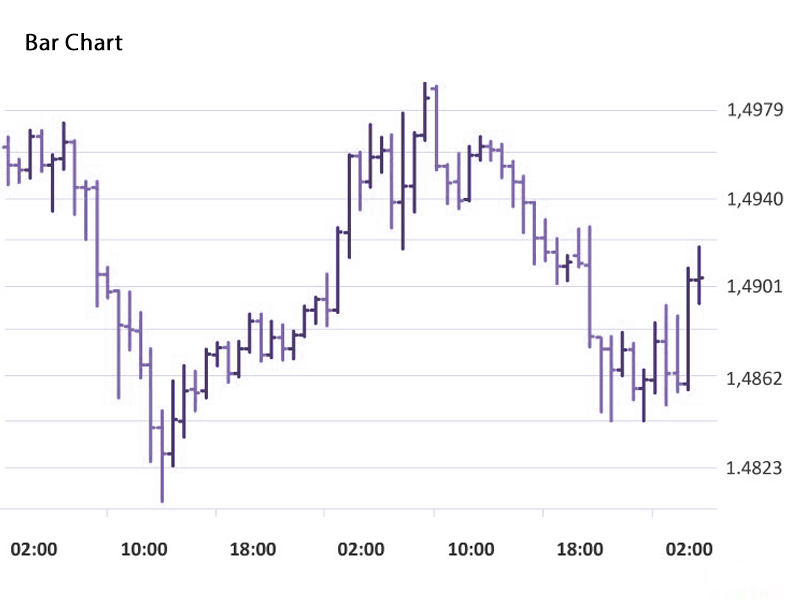
The diagram below for the EUR/USD pair will show you a good illustration of how the bar chart looks like.
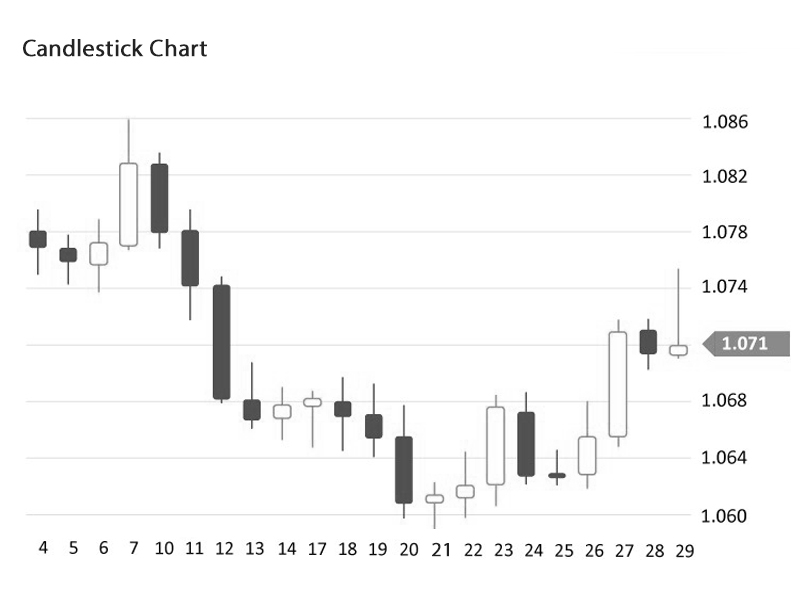
Candlestick charts
The candlestick charts use a vertical line to show the high-to-low trading ranges just as how other Forex charts do too. There are several blocks you will find in the middle which shows the opening and closing price ranges.
A colored or filled middle block means that the closing price of a currency pair is lower than its opening price. On the other hand, when the middle block has a different color or it is unfilled, then it closed at a price higher than the one it opened.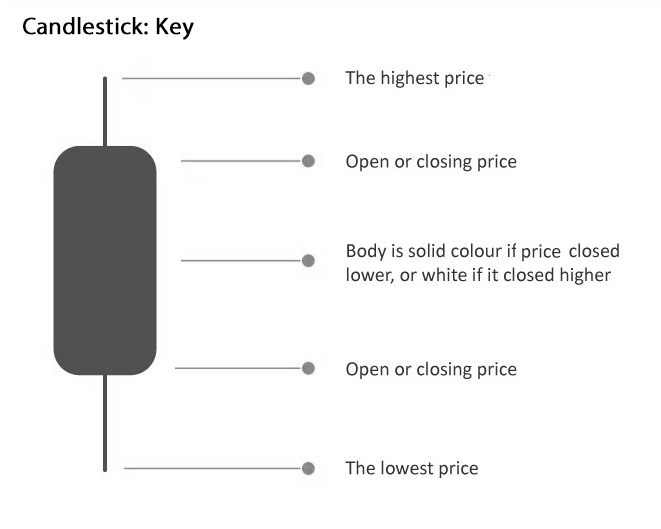
How to Read Candlestick Charts
To read a candlestick chart, you must first understand that it comes in two formations; the seller and buyer candles just as seen below.
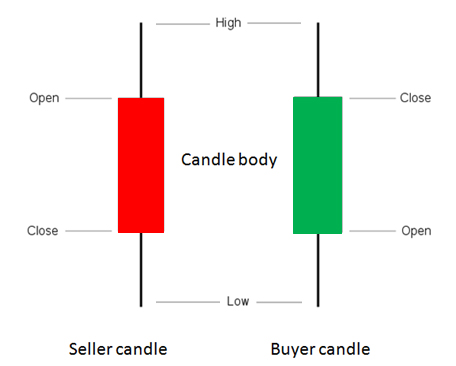
These two candle formations also give you as a trader very important information. These include:
- The green candle which is occasionally white represents the buyer and explains that the buyer triumphed in a given time because the level of the closing price is higher than that of the opening.
- The red candle which is occasionally black represents the seller and explains that the seller triumphed in a given time because the level of the closing price is lesser than that of the opening.
- The levels of the low and high price explain that the lowest price and highest price attained in a period was selected.
Conclusion
If you do not know the doings of Forex, you are bound to make several mistakes and the first step in preventing such from happening is to know how to read the charts. There are numerous kinds of Forex charts but the three we have highlighted here are the top ones. You could go with whichever you feel suits you and understand how the charts work before diving into the world of Forex.
Click on the button below to Download our "How to read Forex charts" Guide in PDF
