Advanced candlestick patterns every trader should know
The analysis of market behavior through advanced candlestick patterns requires more than basic single-candle signals because these patterns consist of multiple candles. The patterns emerge from two or more candles which demonstrate how market participants interact during brief time spans. The complete price information in each candle enables traders to track market control shifts with high accuracy. The market shows signs of trend reversal because upward price movement has decreased while downward market pressure has become extremely strong. The patterns help traders perform structured market probability assessments but they do not predict exact price changes. The combination of these patterns with support and resistance tools enables traders to create particular entry and exit strategies. The creation of an advanced reversal pattern at a critical price point allows traders to create protective positions through defensive trading methods.
Why advanced candlestick patterns matter in modern trading
Advanced candlestick patterns hold value because they convert unfiltered price data into organized market indicators which traders can analyze through logical methods. The market activity between buyers and sellers during each time period creates the data that forms each candle. The market direction changes through various candle patterns which create particular sequences. The combination of rising prices with an exhaustion pattern near resistance levels indicates that buying power is decreasing. The evaluation of market conditions through these patterns enables traders to make better decisions about their position size and risk management and profit target settings. A trader who risks one percent of their account equity per trade can use advanced pattern confirmation to locate their entry point while establishing specific stop-loss levels instead of depending on luck. The patterns help traders prevent emotional trading choices through their predefined market entry protocols. The combination of these patterns with trend analysis and price level monitoring and volatility indicators leads to better trade execution results. The successful implementation of these signals requires traders who possess chart analysis abilities and follow strict risk management rules.
Market psychology behind advanced candlestick formations
Market participants' collective actions become visible through candlestick formations because prices respond to information and market liquidity and risk levels. The fixed time period contains all buying and selling decisions which form a single candle. Market sentiment develops through specific patterns which form when multiple candles create particular structures. The market shows increasing seller resistance through long upper wicks which form after prices have been rising steadily. The repeated testing of resistance levels by price with decreasing closing values indicates that market momentum is losing strength. The patterns show market order activity through their depiction of supply exceeding demand and demand being insufficient to meet supply levels. Market behavior patterns become more understandable for traders through psychological analysis which helps them move past basic visual pattern identification. The method enables traders to create organized trading strategies through direct connections between market prices and actual investor deals.
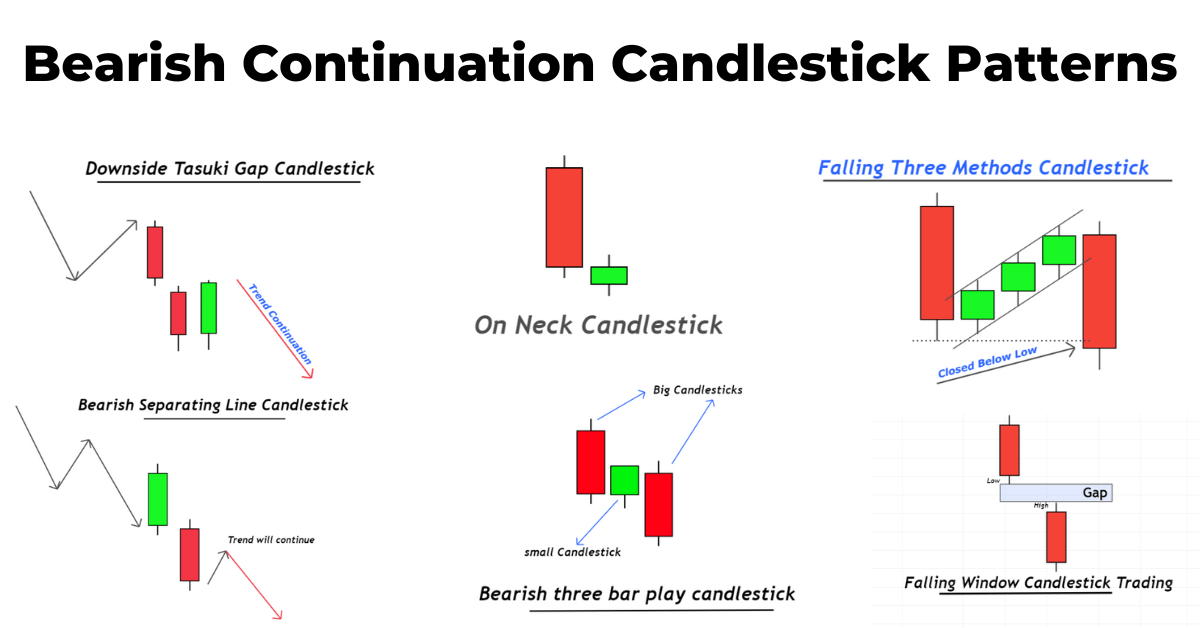
Breakout and continuation candlestick patterns
The breakout and continuation candlestick patterns enable traders to locate specific market points which tend to follow the current market direction. The breakout pattern emerges when price exceeds its usual boundaries through powerful candles which display minimal opposing wicks. Market participants have made a decisive trading move according to the pattern. The market follows a continuation pattern because prices remain stable while the trend continues before the market resumes its current direction. The market demonstrates controlled consolidation instead of reversal through its production of multiple small-bodied candles which show rising lower price levels. The market structure shows a continuation pattern because price moves 60 pips above its previous level before entering a 15-pip tight range which leads to a strong bullish candle that closes above this range. The pattern helps traders enter trades at better times because it helps them avoid random market entries while following market direction.
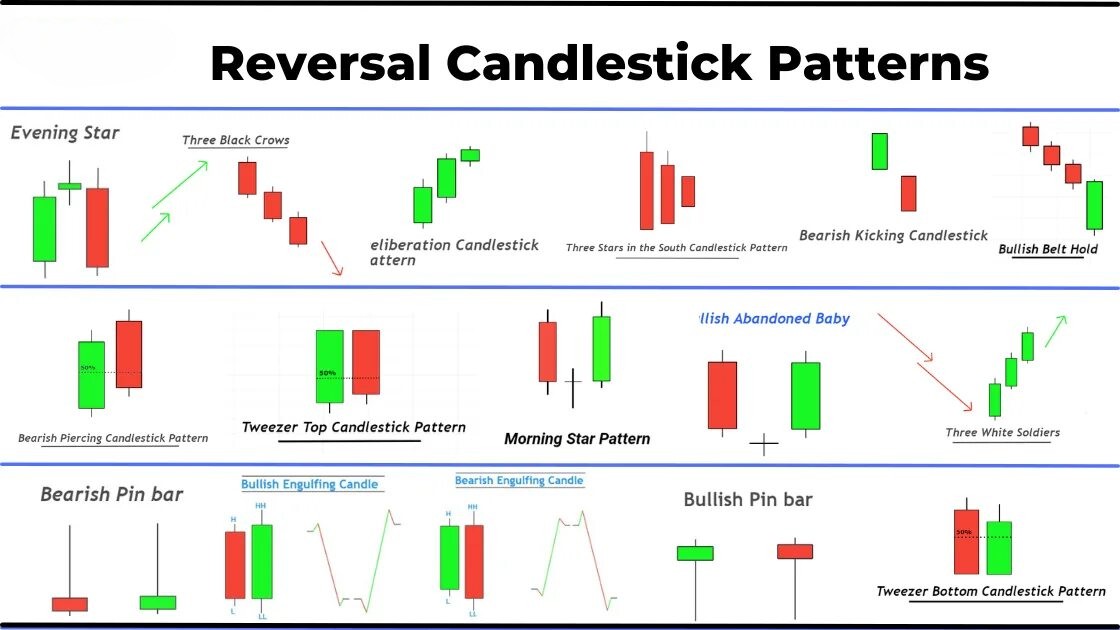
Reversal candlestick patterns in trending markets
The reversal candlestick patterns show market direction changes will occur after prices have moved for an extended period. Market trend forces lose their power at this point which allows opposing market orders to gain control and create patterns. The market indicates buyer weakness through its extended upper wicks which occur with its tight closing ranges during an uptrend. Market sellers experience rising buying interest because downtrend prices end at higher levels with smaller wicks that extend. The market indicates growing interest through its price decrease of 120 pips across different trading periods and its formation of a strong bullish reversal pattern at a previous support level. The market transition from candles with decreasing downward ranges to a strong upward close enables traders to establish their stop-loss at the recent low point while they determine their risk exposure. The market reversal patterns do not predict upcoming market trends but they create particular trading alerts which traders can use to modify their market positions or safeguard their existing market investments. The patterns require continuous chart monitoring with scheduled testing to achieve reliable results through controlled market entry.
Multi-candle confirmation patterns
The strength of trade signals increases when price movements from multiple consecutive sessions match each other through various candle patterns. The market pressure becomes evident through these formations because they prove that market direction persists instead of being a brief occurrence. The system protects traders from false market reactions because it ignores brief price fluctuations and short-term market volatility. The first reversal candle needs confirmation from two following candles which show rising prices to make a bullish setup more reliable. Market evidence shows that buyers take part in market deals but they still control market direction. The market validation of follow-through occurs when prices rise between 25 to 40 pips during the next two sessions after a reversal candle forms near support. The system needs more market activity to confirm its first signals because this helps users prevent making wrong market entries. The evaluation of these patterns across different market conditions enables traders to develop their trading skills while maintaining strict risk management.
Volume and volatility in candlestick pattern validation
The evaluation process for complex candlestick patterns needs Volume and Volatility data to serve as verification tools. The direction of price movement becomes visible through volume data which shows the power level of market movements. The growing trading volume of breakout candles shows that more market participants are taking part than individual traders. Volatility data enables the measurement of price change speed and current market range dimensions. A bullish breakout that happens with low market volatility will not sustain its momentum but the same breakout during increasing volatility will demonstrate stronger market direction. The currency pair shows a 30-pip daily range before it expands to 80 pips during the breakout candle with increasing volume which creates a stronger chance of price continuation. Volume data analysis enables traders to identify fake reversal signals because trading signals from weak market participation do not lead to profitable trades. Volatility helps traders set correct stop-loss levels and choose position amounts by using market prices to measure their risk exposure.
Integrating advanced candlestick patterns into a trading strategy
The most effective use of advanced candlestick patterns emerges when traders use them inside a trading system which runs based on predefined rules. The trading system needs pattern signals to verify market direction and detect vital support and resistance points and market structure elements. A bullish continuation pattern becomes more effective when it forms above an increasing moving average and near a confirmed support level. The trader uses a set risk model of 1 percent per trade and a specific stop distance of 40 pips which enables pattern-based entries to produce consistent position sizes instead of impulsive decisions. The evaluation of entry points becomes more detailed when using short-term periods but longer periods show market trend directions. The complete exit strategy becomes more effective through the combination of pattern targets with previous price zones for exit planning. The system allows users to perform visual price analysis which produces specific risk and reward metrics through its structured framework. The system maintains stability through its scheduled evaluation process and its methodical trading approach updates.
Conclusion
Advanced candlestick patterns help analysts understand price behavior through structured analysis when used within a systematic evaluation system. These patterns show actual changes in market demand instead of depending on random visual patterns. The successful implementation of these patterns needs to match the market trend and protect vital price points and volume patterns and establish specific risk boundaries. The formation of confirmed continuation patterns inside established trends with expanding volatility enables traders to create entry plans with specific stop-loss levels and profit goals. The evaluation of every trading opportunity needs to consider its place in a series of probability events instead of analyzing it separately. The strategy maintains a 1 percent risk per trade for one hundred trades which produces stable long-term results through managed drawdowns when pattern accuracy remains at a moderate level. The process of chart evaluation and performance monitoring and systematic market cycle testing helps traders improve their execution skills.
