Advanced Fibonacci strategies for forex trading
The foreign exchange market uses Fibonacci analysis as a common analytical tool which depends on mathematical price patterns that tend to repeat in market movements. The ratios in forex trading help traders find potential price retracement points and continuation areas and pause or reverse points. The research operates under the assumption that market movements lack predictable patterns yet traders create specific price patterns which can be identified.
A currency pair experiences a significant price increase when a central bank makes an announcement. The market movement gets measured by traders who then use Fibonacci ratios to predict the location of short-term market corrections before the market trend continues. Traders can find suitable entry points through price movement analysis at particular percentage levels which also helps them determine their risk exposure.
Most professional trading platforms include Fibonacci tools which traders use together with their fundamental knowledge of position sizing and pip value calculation and risk management limits. When applied correctly, they support structured decision-making rather than prediction.
The mathematical foundations of Fibonacci ratios
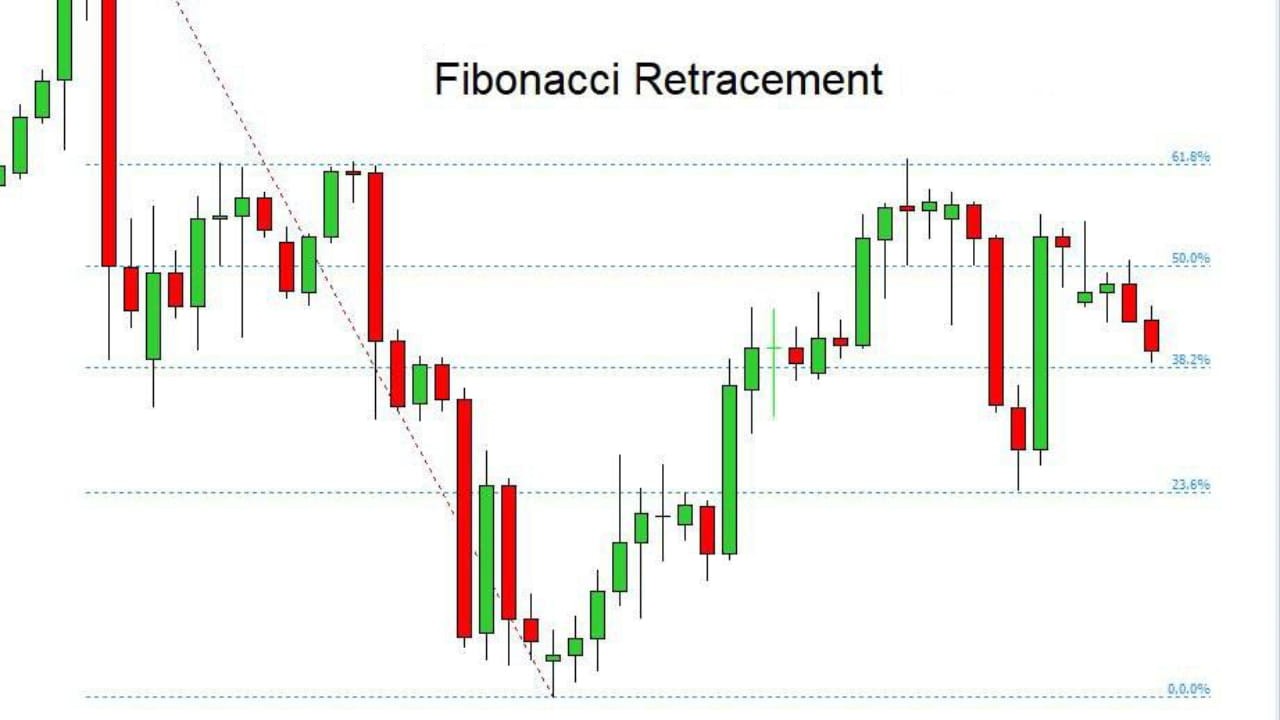
Fibonacci ratios originate from a numerical sequence in which each number is the sum of the two preceding values. When relationships between these numbers are expressed as percentages, several ratios repeatedly appear in financial price data. The Forex market participants use these ratios to study real market price behavior instead of performing abstract mathematical computations.
A currency pair which increases by 100 pips. The Fibonacci retracement tool enables users to predict future market pullbacks through its application of specific ratios to the measured distance. The 38.2 percent retracement indicator shows a market decline of 38 pips from its peak while the 61.8 percent retracement indicator predicts a more significant market drop of 61 pips. The calculations use a linear system which calculates price distance to produce results that align with conventional trading methods including pip value and position sizing.
The process of executing forex trades through lots requires traders to maintain their ability to convert market price changes into actual financial risks. Investors can understand their investment risk versus potential gain through the evaluation of measured retracement levels.
Why Fibonacci tools matter in institutional forex trading
The Fibonacci tools serve as essential monitoring tools for institutional forex traders because they help them understand how professional traders evaluate market price fluctuations and market liquidity and risk levels. The operations of banks and hedge funds and proprietary trading desks involve large position sizes which they express through standard lots because any market price movement will significantly impact their financial results. The exposure to radiation can be controlled through the use of structured reference levels which provide consistent management.
The institution establishes a long position of 10 standard lots on a major currency pair after a macroeconomic release occurs. The value of a single pip movement requires exact entry and exit planning because it creates substantial monetary effects. The Fibonacci retracement levels create specific price zones which traders can use to evaluate their market decisions by measuring distances instead of depending on individual judgments.
The combination of Fibonacci levels with established liquidity zones helps traders protect their margin usage and leverage during times of market volatility. These tools enable probability-based decision-making through a risk framework but they do not predict future results.
Advanced Fibonacci retracement techniques
The advanced Fibonacci retracement methods enable users to develop improved entry techniques and risk control systems which go beyond identifying standard market price adjustments. Forex traders use retracements to analyze defined market movements which start at important price lows and end at important price highs or vice versa. The exact measurement determines how much capital traders can use for their market trading activities.
A trader detects that the major currency pair will experience a 120-pip price increase. Applying Fibonacci retracements divides that move into proportional price levels. The 50 percent retracement level would result in a market movement of 60 pips. The price movement of one standard lot would result in a 600-unit market value because each pip of the account currency has a value of 10 units. The calculation enables us to find stop placement positions which meet both acceptable margin usage requirements and leverage restrictions.
The advanced application requires specialists to analyze price movements at these levels because the market will not automatically reverse. The market structure becomes more defined when it reaches its present price extremes and holds positions within its established consolidation areas.
Fibonacci extensions for trend continuation and profit targeting
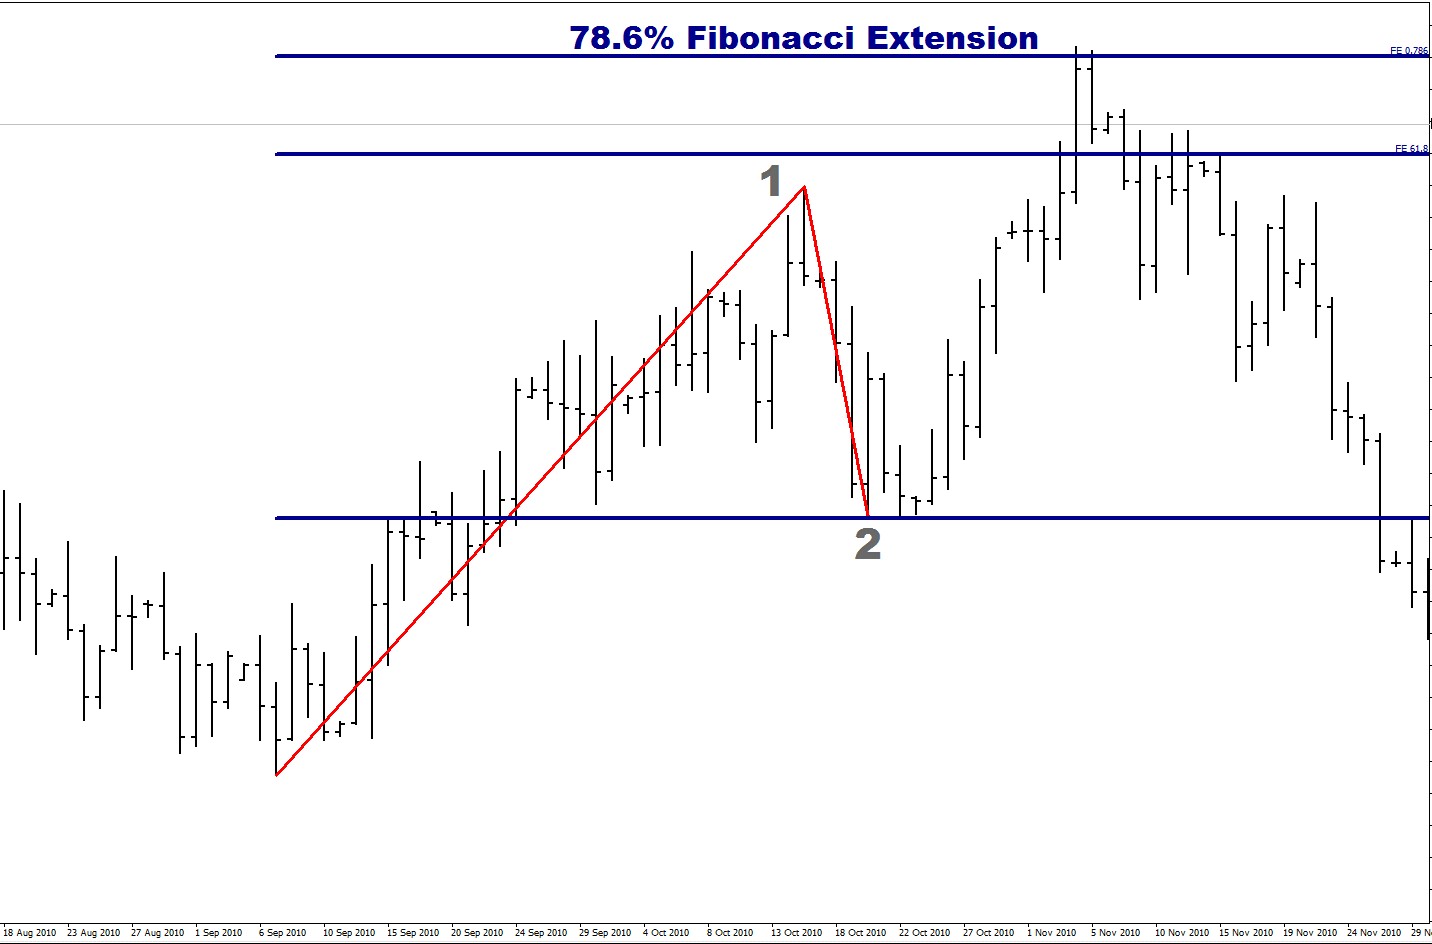
The Fibonacci extension method enables traders to forecast upcoming price points when market trends exceed their previous highest and lowest points. Unlike retracements, extensions project future price levels based on the size of an earlier price swing. These projections help define profit objectives while maintaining clarity around risk and reward.
A currency pair starts at a swing low before it rises 80 pips to reach a swing high before it starts to move back down. The Fibonacci extension method reveals possible future price points which go beyond the initial peak. The 127.2 percent extension would result in a price increase of 22 pips beyond the previous market high. The 161.8 percent extension would lead to a price movement of about 50 pips. The trading of one standard lot enables traders to determine their profit potential because each pip movement in the market equals 10 units of their account currency.
The system enables users to create structured exit plans through its extension module which becomes more effective when users set specific lot sizes and margin boundaries and leverage limits. The use of projected levels provides specific target values which replace the need to make uncertain predictions about trend endings.
Fibonacci confluence zones and market structure
The Fibonacci confluence zones appear when different technical reference points meet at a specific price point which stays within a small price range. The zones become more important when Fibonacci retracement or extension levels match previous market highs and lows and areas of consolidation. Market structure explains why these specific areas tend to draw more trading operations and liquid assets.
A currency pair starts with a 150 pip decline before it starts to move back in the opposite direction. The 61.8 percent price correction point often matches a past support area which now functions as a resistance point. The common section between these two markets functions as a space which increases the chances of price fluctuations. One standard lot contains 10 units of account currency which makes the average pip value of this lot equal to 10 units of account currency. The market movement of 20 pips creates a specific level of risk exposure. The calculation helps to match the size of the lot with the position of stops and the amount of margin available.
The ability of traders to identify market conditions depends on their knowledge of present market trends which they obtain from confluence zones. The particular market sections show their price behavior which enables traders to develop improved market access strategies for their trading operations.
Combining Fibonacci with support, resistance, and price action
The combination of Fibonacci analysis with support, resistance and price action elements improves both the organization and the simplicity of trade planning procedures. The Fibonacci levels show market price zones which follow proportional patterns but support and resistance levels show where traders have shown their past reactions. Price action confirms market movements through direct observations of market behavior which includes rejection and consolidation and continuation patterns.
A currency pair moves back to the 50 percent Fibonacci level which matches its previous resistance area. The market shows decreasing momentum through two price patterns which include price slowdown and the formation of multiple small candles in a row. The current market zone would result in a one standard lot position which would translate to 10 units of account currency for each pip movement. The 25-pip stop with established limits helps traders set particular risk levels which helps them control their margin and leverage usage.
The system uses multiple indicators which work together to decrease dependence on any one particular metric. The Fibonacci method establishes the trading zone but support and resistance levels provide additional information which helps traders determine their entry points. The analysis of historical market data enables traders to detect regular market behaviors which leads to better trading performance. Risk management consistency develops through continuous market practice adoption which leads to better decision-making through probability-based methods.
Conclusion
Traders need to stick to their fundamental trading rules when using Fibonacci strategies to analyze price movements because these methods depend on their core principles for success. The tools enable users to identify price zones and execution windows but their actual value emerges when users integrate them with exact risk assessment methods and trading protocols.
The analysis of Fibonacci patterns exists to assist traders in their choices but it should not function as a standalone decision-making tool. Market conditions together with market volatility and trading market liquidity determine the most important elements for investment decisions.
