Ascending and descending triangle pattern
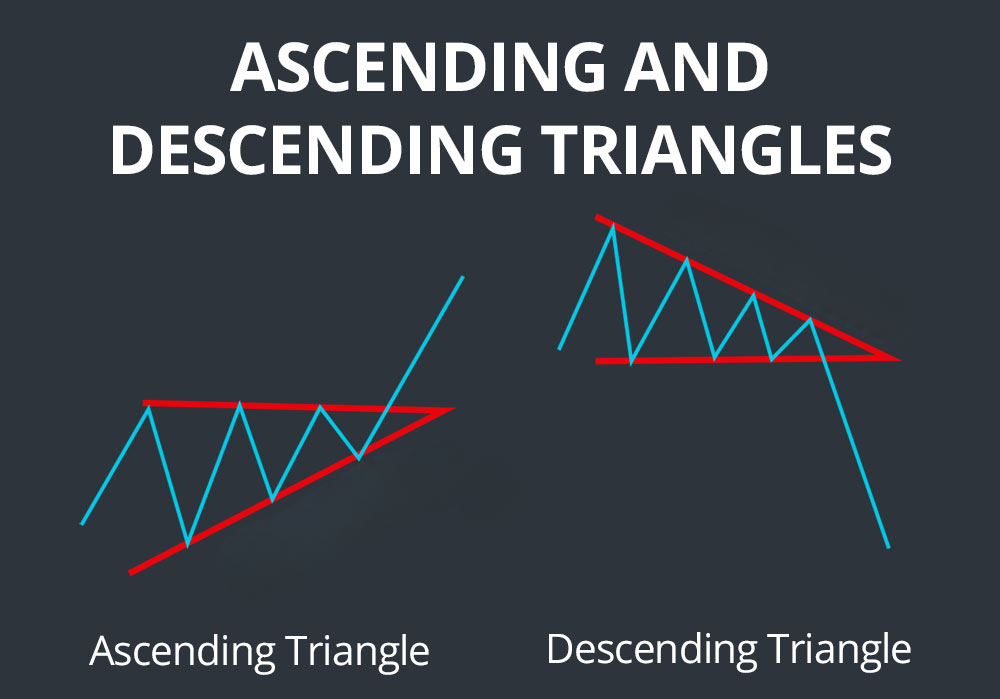
In the world of forex trading, technical analysis is an essential tool for predicting market trends and making informed trading decisions. One such tool is the ascending and descending triangle pattern. These patterns are formed on price charts when the price consolidates between two trendlines, creating a triangular shape. The ascending triangle pattern is characterized by a horizontal resistance level and an upward-sloping trendline, while the descending triangle pattern features a horizontal support level and a downward-sloping trendline.
Identifying and understanding these patterns is crucial for forex traders, as they can provide valuable insight into potential market trends and trading opportunities. In this article, we will explore the ascending and descending triangle patterns in forex, discussing their characteristics, how to identify them on a chart, and their significance in technical analysis. We will also provide examples of these patterns in real market situations and discuss various trading strategies for utilizing them effectively. Finally, we will examine the differences between ascending and descending triangle patterns and provide general tips and potential risks associated with trading with these patterns.
Definition and Characteristics
An ascending triangle pattern is a technical analysis pattern that is formed when the price of an asset is consolidating between two trendlines, with the upper trendline sloping upward and the lower trendline horizontal. The pattern is characterized by a horizontal resistance level that is tested multiple times by the price action, and a series of higher lows that indicate an upward trend.
The pattern is considered to be bullish as the market consolidates and buyers continue to enter the market, causing the price to rise to the resistance level. If the resistance level is eventually broken, the price may continue to rise, providing an excellent trading opportunity for forex traders.
How to Identify an Ascending Triangle Pattern on a Chart
Identifying an ascending triangle pattern on a chart is relatively straightforward. Forex traders should look for a series of higher lows that form the ascending trendline, while the horizontal resistance level is formed by the price reaching a similar level multiple times. The more times the resistance level is tested, the stronger the pattern is considered to be.
Examples of Ascending Triangle Patterns in Real Market Situations
One example of an ascending triangle pattern in forex trading occurred in the USD/JPY currency pair in early 2020. In this case, the price had been trading in a range for several months, with a horizontal resistance level at around 109.70 and a series of higher lows forming the ascending trendline. The pattern was eventually confirmed when the price broke through the resistance level and continued to rise, offering an excellent opportunity for traders to enter a long position.
Significance of an Ascending Triangle Pattern in Technical Analysis
The ascending triangle pattern is significant in technical analysis as it provides valuable information about the market's sentiment and potential future trends. It indicates that buyers are entering the market and pushing the price up, creating a bullish sentiment. The pattern also allows traders to identify potential entry and exit points and set stop-loss orders to manage their risk effectively.
Trading Strategies for an Ascending Triangle Pattern
There are several trading strategies that forex traders can use to take advantage of an ascending triangle pattern. One strategy is to enter a long position once the price breaks through the resistance level, with a stop-loss order placed below the support level. Another strategy is to wait for a pullback to the support level and enter a long position, with a stop-loss order placed below the support level.
Definition and Characteristics of a Descending Triangle Pattern
A descending triangle pattern is a bearish continuation pattern that forms when the price makes lower highs and meets a horizontal support level. The price tends to consolidate within a narrowing range as the bears become increasingly dominant. The pattern is completed when the price breaks below the horizontal support level, signaling a continuation of the downtrend.
How to Identify a Descending Triangle Pattern on a Chart
To identify a descending triangle pattern, traders need to look for the following:
A clearly defined horizontal support level: This should be a level where the price has bounced off several times in the past.
Two or more lower highs: These are points where the price fails to reach a previous high, indicating a weakening of buying momentum.
A downward-sloping resistance line: This is a trendline that connects the lower highs.
Once the pattern is identified, traders can anticipate a breakout to the downside, signalling a continuation of the downtrend.
Significance of a Descending Triangle Pattern in Technical Analysis
Descending triangle patterns are significant because they provide traders with a clear indication of a bearish continuation of the downtrend. The pattern is a sign of increasing bearish pressure and a weakening of buying momentum. Traders can use this pattern to anticipate a potential downside breakout and adjust their trading strategies accordingly.
Trading Strategies for a Descending Triangle Pattern
There are several trading strategies that traders can use when a descending triangle pattern forms:
Short Sell: Traders can place a short sell order below the horizontal support level, anticipating a downside breakout.
Stop-Loss Order: To manage risk, traders can place a stop-loss order above the horizontal support level, in case the price breaks out to the upside.
Profit Target: Traders can set a profit target by measuring the distance between the highest point of the triangle and the horizontal support level, and projecting that distance from the breakout point.
Comparison of the two patterns in terms of formation and characteristics:
Ascending and descending triangle patterns are both continuation patterns, which means they tend to occur in the middle of an established trend and suggest that the trend will continue. However, the two patterns have different formations and characteristics.
An ascending triangle pattern is formed when there is a horizontal resistance level that has been tested multiple times and an upward sloping trendline that acts as support. As the price approaches the resistance level, it is likely to break out to the upside and continue the uptrend. The pattern is characterized by higher lows and a horizontal resistance level.
A descending triangle pattern, on the other hand, is formed when there is a horizontal support level that has been tested multiple times and a downward sloping trendline that acts as resistance. As the price approaches the support level, it is likely to break out to the downside and continue the downtrend. The pattern is characterized by lower highs and a horizontal support level.
How to distinguish between an ascending and descending triangle pattern on a chart:
Distinguishing between an ascending and descending triangle pattern on a chart can be tricky, as the two patterns have a similar shape. One way to differentiate between the two is to look at the slope of the trendline. In an ascending triangle pattern, the trendline slopes upward, while in a descending triangle pattern, the trendline slopes downward. Additionally, the horizontal level in an ascending triangle pattern is resistance, while in a descending triangle pattern, it is support.
It's also important to consider the context of the pattern. If the pattern occurs after an uptrend, it is more likely to be an ascending triangle pattern, while if it occurs after a downtrend, it is more likely to be a descending triangle pattern.
Importance of recognizing the difference between the two patterns for trading decisions:
Recognizing the difference between ascending and descending triangle patterns is crucial for making trading decisions. For example, if an ascending triangle pattern is identified, it suggests that the price is likely to break out to the upside, and traders may consider buying the asset. Conversely, if a descending triangle pattern is identified, it suggests that the price is likely to break out to the downside, and traders may consider selling the asset.
It's also important to consider the volume of trading activity during the formation of the pattern. If the volume is low, it suggests that there may not be enough buying or selling pressure to sustain a breakout, and traders may want to wait for higher volume before making a trade.
General Tips for Trading with Triangle Patterns
Confirm the Pattern: Before making any trades based on a triangle pattern, it's important to confirm that the pattern is valid. This can be done by waiting for a breakout above or below the pattern's resistance or support level, respectively.
Use Multiple Indicators: It's important to use multiple indicators to confirm a pattern, as relying on only one indicator can be risky. Technical indicators such as moving averages, RSI, and MACD can help confirm a pattern's validity.
Keep an Eye on Volume: Volume can be a helpful indicator of a pattern's strength. High volume during a breakout can indicate that the pattern is strong and more likely to continue.
Use Stop Losses: Stop losses can help minimize losses in case the pattern doesn't follow through as expected. It's important to set stop losses at a reasonable distance from the entry point to prevent being stopped out prematurely.
Specific Trading Strategies for Ascending and Descending Triangle Patterns
Ascending Triangle Trading Strategy:
Identify the Pattern: Look for an upward trend in price that is met with a resistance level that's horizontal or slightly downward sloping.
Confirm the Pattern: Wait for the price to break through the resistance level, with high volume to confirm the pattern's validity.
Enter the Trade: Enter a long position once the price has broken through the resistance level, with a stop loss below the resistance level.
Set Targets: Set profit targets at twice the height of the triangle pattern, measured from the resistance level to the trendline. This can provide a good reward-to-risk ratio.
Descending Triangle Trading Strategy:
Identify the Pattern: Look for a downward trend in price that's met with a support level that's horizontal or slightly upward sloping.
Confirm the Pattern: Wait for the price to break through the support level, with high volume to confirm the pattern's validity.
Enter the Trade: Enter a short position once the price has broken through the support level, with a stop loss above the support level.
Set Targets: Set profit targets at twice the height of the triangle pattern, measured from the support level to the trendline.
Potential Risks and Drawbacks of Using Triangle Patterns in Trading
False Breakouts: Triangle patterns are not always accurate predictors of future price movements. False breakouts can occur when the price briefly breaks through the support or resistance level, only to quickly reverse.
Delayed Breakouts: Triangle patterns can take a long time to form, and the breakout can be delayed. This can lead to missed opportunities or trading losses if stop losses are too tight.
Other Factors: Triangle patterns do not take into account other fundamental factors that can impact price movements, such as economic events or news releases.
Conclusion.
In conclusion, ascending and descending triangle patterns are two important chart patterns in technical analysis and trading. These patterns can provide valuable information about potential price movements and entry and exit points for traders. An ascending triangle pattern is characterized by a flat resistance level and a rising support level, while a descending triangle pattern has a flat support level and a falling resistance level. To identify these patterns, traders can look for specific price movements and chart formations, such as higher lows in an ascending triangle or lower highs in a descending triangle.
Trading strategies for these patterns may include entering long positions when the price breaks above the resistance level of an ascending triangle or short positions when the price breaks below the support level of a descending triangle. It is important to note, however, that these strategies come with potential risks and drawbacks, such as false breakouts or the possibility of the price reversing unexpectedly.
In order to successfully trade with triangle patterns, it is essential for traders to have a solid understanding of technical analysis and chart patterns. They should also be prepared to monitor the markets closely and adjust their strategies as needed. By utilizing ascending and descending triangle patterns in their trading decisions, traders can potentially increase their chances of success and profitability in the forex and other financial markets.
