Bollinger band forex strategy
One of the most acknowledged methodological tools widely used by financial traders as a component of technical analysis, primarily to inform trading decisions, control automated trading systems and various other trading related purposes is the Bollinger band.
It was designed by John Bollinger in the 1980s to predict and trade highly probable opportunities of oversold and overbought market conditions.
A good understanding of the Bollinger band is a prerequisite to use and implement the indicator appropriately and profitably in the forex market.
WHAT CONSTITUTES THE BOLLINGER BAND INDICATOR
The Bollinger band has the structure of a channel-like envelope which is made up of statistically plotted upper and lower moving averages and a simple moving average at the centre.
Together they serve a purpose to measure the relationship between price movement and the volatility of an asset or forex pair over a period of time.
The plotted upper and lower moving averages of the bollinger band forms a channel that is sensitive to price movement and adjusts its width by expanding and contracting in response to the changes in the volatility of price movement and the conditions of the market.
Therefore it is easy for traders to analyse all the price data of a forex pair and confirm confluence signals of other indicators within the confines of the band.
Example of a Bollinger band on a candlestick chart
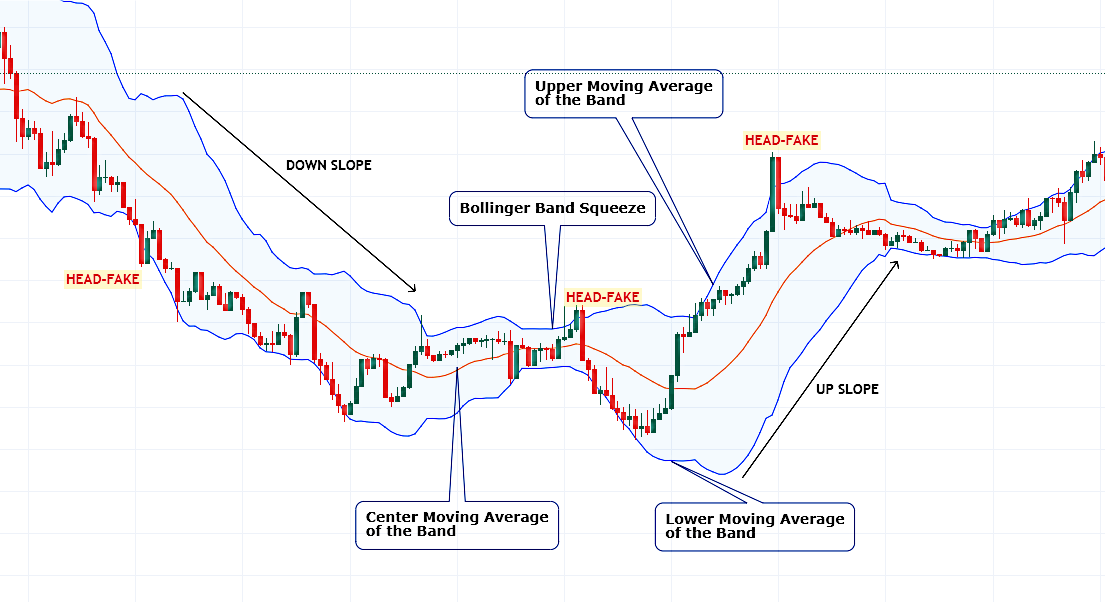
HERE IS A SHORT DESCRIPTION OF THE COMPONENTS OF THE BOLLINGER BAND
The upper, lower and center moving averages of the channel-like bollinger band are simple moving averages (SMAs) with a default 20 lookback period on any timeframe.
The distance between the upper and lower simple moving averages (SMA) that make up the boundaries of the channel is segregated by a difference in their standard deviation while the moving average (SMA) at the center has no standard deviation.
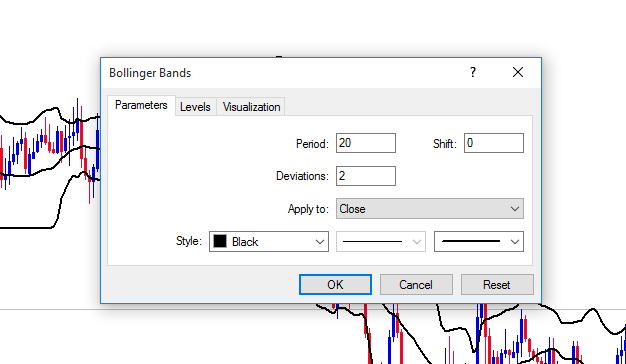
The Bollinger band uses these three parameters to form a price volatility sensitive channel with the following default setting:
The upper line of the channel is a 20 period simple moving average (SMA) with a standard deviation STD of +2.
The lower line of the channel is a 20 period simple moving average (SMA) with a standard deviation STD of -2.
The middle line of the channel is a 20 period simple moving average (SMA) with no standard deviation STD.
By default, the simple moving averages of the bollinger band are all calculated using the closing prices of the trading activities on any timeframe.
All these default settings can be adjusted or customized to fit different trading strategies.
Bollinger band setup
WHAT ARE THE CHARACTERISTICS OF THE BOLLINGER BAND
The Bollinger band has some unique characteristics as it relates to price movement that makes it an almost inevitable methodological tool for technical analysis of the financial market as a whole.
Bollinger Band as a Lagging Indicator
Bollinger band is inherently a lagging indicator because its basic readings on price data is not predictive but reactive to price movement and the ever-changing conditions of the market.
The band usually expands after price have evidently increased in volatility and then the width of the band also reduces as price volatility decreases.
The distance between the upper and the lower simple moving averages (SMA) is a measure of the present price volatility.
Bollinger Band as a Leading Indicator
The bollinger band also act as a leading indicator presenting reversal signals whenever price comes in contact with or punches through the boundaries of the band.
Price usually reacts to the boundaries of the bollinger band channel like dynamic support and resistance and during strong trends, prices tend to pierce through the channel thereby enlarging the channel even more but this is indicative of the possibility of an impending reversal as an oversold and overbought market condition.
Bollinger Band relative to Market Volatility Cycle
According to market volatility cycles, it is commonly understood that consolidating price movement precedes trends or explosive price moves. Moreover, a trending or explosive price movement precedes a consolidation, a retracement or reversal.
Hence, if the market is trending or there is an increase in price volatility, the upper and the lower moving average will increase in distance correspondingly. On the contrary, if the market is not trending or is in a consolidation, the channel will constrict in distance.
Bollinger Band Squeeze and Breakouts
The Bollinger band is mostly known for its squeeze and breakout prediction of future price movement which is in sync with the general concept of volatility cycles also known as the Interbank Price Delivery Algorithm.
Squeeze is a general notion of the bollinger band. The term expresses the constriction or tightening of the bollinger band channel which is normally a result of sideways price movement or tight ranges.
At this phase of the market, there is usually impending volatility of explosive price move from the build-up of bullish or bearish orders in the squeeze.
Unfortunately, the squeeze doesn’t predict or guarantee the direction of the anticipated price breakout.
Bollinger Band Used To Identify Trend
To better identify or discern a trend or the dominant direction of the market, traders use the simple moving average at the center of the channel to determine the dominant direction of price movement and if the asset or forex pair is actually trending or not.
Bollinger Band Head-Fakes
The term ‘Head-fake’ was coined by the developer to describe a false price breakout of the bollinger band channel or the bollinger band squeeze. This is a very important concept of the bollinger band.
It is not unusual for price movement to turn direction after a breakout at the extremes of the Squeeze as if to induce traders into assuming that the breakout will occur in that direction, only to reverse and make the real, most significant move in the opposite direction.
Traders who initiate market orders in the direction of any breakout often get caught offside, which can prove extremely costly if they do not use stop-losses. Those expecting the head fake can quickly cover their original position and enter a trade in the direction of the reversal.
Head-fakes reversal signals must as well be confirmed with other indicators.
BOLLINGER BANDS FOREX STRATEGIES
We have gone through the characteristics of the bollinger band. There are three basic trading strategies that are a direct by-product of the Bollinger band indicator and its characteristics, more so, they apply to all timeframes. We have the Bollinger band squeeze breakout strategy, trend trading strategy and the head-fake trading strategy.
- Bollinger band squeeze breakout strategy.
To trade the bollinger band breakout properly,
- Delineate a 120 look back period on any timeframe.
for example:
On the daily chart; look back at 120 candlesticks or bars.
On the 1hr chart; look back at 120 candlesticks or bars.
- Identify the most recent and most significant squeeze in the 120 look back period.
- Confirm the squeeze by a significant drop in the bandwidth indicator.
- There are usually a lot of false breakouts from the squeeze of the bollinger band. So therefore, implement other indicators like the RSI and MACD to confirm the direction of the breakout from the squeeze.
- After further confirmations, initiate a market order in the direction of the breakout after a single candlestick breaks out and close out of the squeeze.
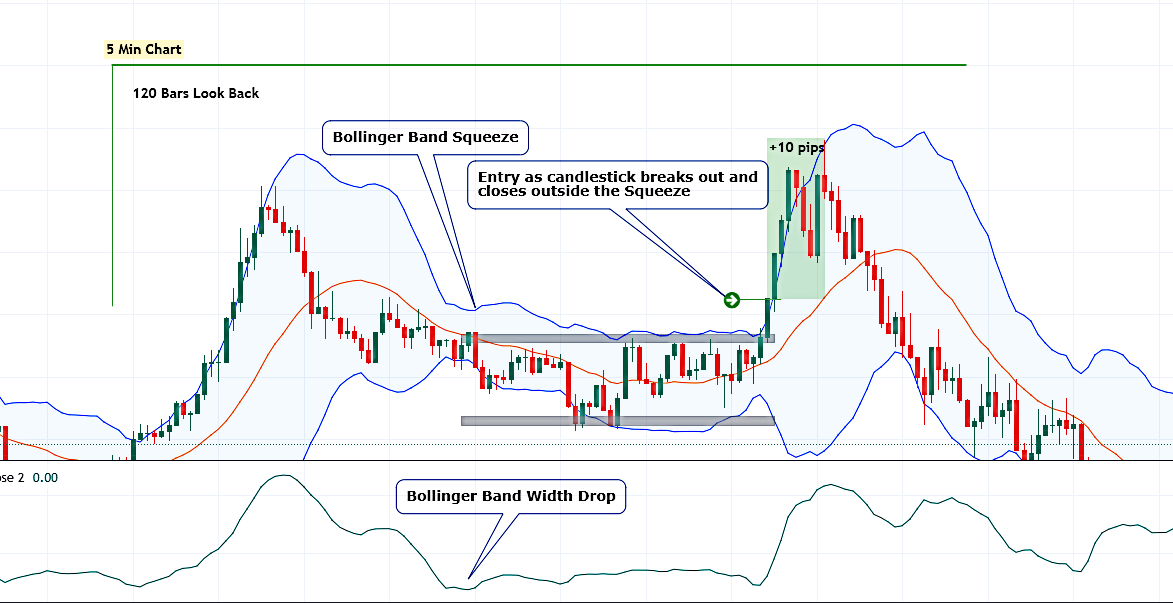
The image above is an example of a squeeze breakout Bollinger band scalping strategy.
- Timeframe: 5 min
- look back period: 120 bars or candlesticks
- Stop loss: at the lower band for bullish setups or the upper band for bearish setups. Stop loss should be no more than 15 pips
- Profit objectives: 15-20 pips
- Trend trading strategy
- Confirm that the Bollinger band is in a slope: bullish or bearish.
- Price must be above the middle line to confirm a bullish trend and below the middle line to confirm the bearish trend.
- If the slope is down, look for price retest at the middle band as resistance for short trade setups.
- If the slope is up, look for price retest on the middle band as support for long trade setups.
- Furthermore, confirm the trade idea with other indicators
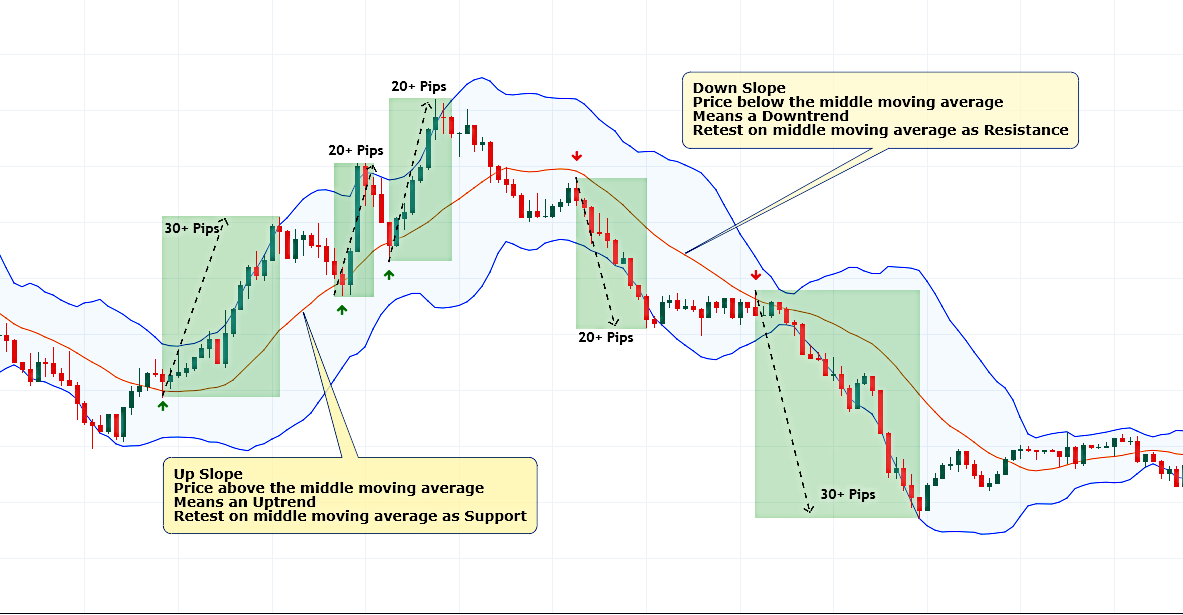
The image above is an example of the Bollinger band trend scalping strategy
- Timeframe: 5 min
- Stop loss: For bullish setup, set stop loss at the lower band, no more than 15 pips.
For bearish setup, set stop loss at the upper band, no more than 15 pips
- Profit objectives: 20-30 pips
Head-fake trading strategy
- This occurs most often when the market is in a trading range
- If price expands above the upper or lower moving average of the channel
- Those expecting the head-fake can quickly enter a trade in the direction of the reversal.
- Look for a candlestick entry pattern such as engulfing candlestick, pin bars and so on.
- Furthermore, confirm the bearish trade idea with other indicators
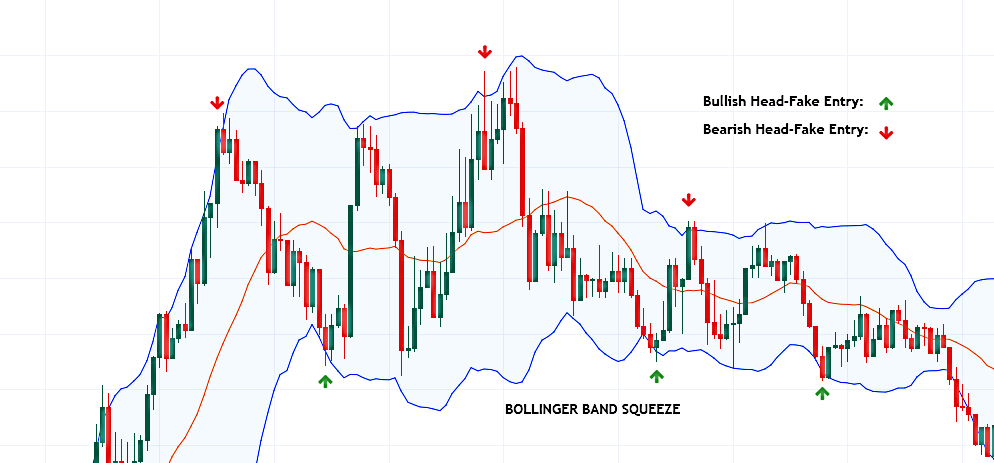
The image above is an example of head-fake Bollinger band scalping strategy
- Timeframe: 5 min.
- Stop loss: 10 pips above or below the head-fake bar or candlestick.
- Profit objectives: 15-30 pips.
SUMMARY OF THE BOLLINGER BAND AND IT TRADING STRATEGIES.
The Bollinger band doesn't necessarily give trade signals. It is mostly used to analyze price movement and to understand the conditions of the market thereby providing hints or suggestions to help traders anticipate future price movements.
Trade setups usually take longer period of time to form on higher time frames like the monthly and weekly chart unlike the lower time frames where a bunch of trade setups do form in a day.
As a result, whenever the band is in a squeeze, scalpers are obligated to avoid a lot of false breakouts (head fakes).
Although the band measures price volatility, gauge trend, determine overbought and oversold market condition. It is not a stand-alone indicator because it doesn't predict signals on its own. Its signals are high probability when confirmed by other indicators.
The developer also recommends that direct signal indicators should be implemented to validate trade setups.
Click on the button below to Download our "Bollinger band forex strategy" Guide in PDF
