Fibonacci Forex Strategy
In forex trading, Fibonacci is arguably the most popular and most widely used tool in the technical analysis of the forex market. It serves forex traders and analysts in many ways such as providing a supportive framework for various trading strategies, identification of accurate and precise price levels where changes in the direction of price movement should occur and many more.
The Fibonacci tool used for technical analysis in the forex market has its building blocks from the Fibonacci sequence which was introduced to the West in the 13th century by Leonardo Pisano Bogollo, an Italian mathematician. The sequence is a string of numbers that have mathematical properties and ratios found in architecture, biology and nature.
These ratios are widely prevalent in the financial markets as they are in the universe.
Before going through the various use cases and applications of the Fibonacci tool in trading. It is important that traders understand the elemental properties of the Fibonacci sequence, its unique mathematical properties and the significant role they play in the technical analysis of price movement.
The Basis of the Fibonacci Retracement and Extension Levels
Fibonacci sequence is a sequence of numbers, wherein the numbers following 0 and 1 are sums of their two previous values hence this sequence continues to infinity. The numbers are
0, 1, 1, 2, 3, 5, 8, 13, 21, 34, 55, 89, 144, 233, 377, 610, 987, 1597, 2584, 4181, 6765….
The mathematical relationships between this sequence of numbers is the basis for which the Fibonacci levels are derived. These levels are represented by numbers but they are not the same as the numbers in the sequence.
There are several of these mathematical relationships but here are the most noteworthy and relevant relationships used in trading.
- a number divided by the previous number approximates to 1.618. For example, 21/13 = 1.615. This is known as the “Golden ratio or Phi”. It is used as a key level in Fibonacci extensions as will be discussed later on in the article.
- a number divided by the next number to the right approximates to 0.618. For example, 89/144 = 0.618.
This number is the inverse of the Golden ratio and it forms the basis for the 61.8% Fibonacci retracement level.
Both of these numbers (the Golden ratio ‘1.618’ and its inverse ‘0.618’ are found throughout nature, biology and the universe.
According to Guy Murchie in his book titled ‘the Seven Mysteries of Life: An Exploration of Science and Philosophy,’ he stated that “the Fibonacci Sequence turns out to be the key to understanding how nature designs... and is... a part of the same ubiquitous music of the spheres that builds harmony into atoms, molecules, crystals, shells, suns and galaxies and makes the universe sing.”
Other noteworthy relationships of the Fibonacci sequence are
- a number divided by another number two places to the right always approximate to 0.382. For example: 89/233 = 0.381. This relationship is the basis for the 38.2% Fibonacci retracement level.
- a number divided by another number three places ahead of it will approximate to 0.2360. For example: 89/377 = 0.2360. This relationship is the basis for the 23.6% Fibonacci retracement level.
The Golden Ratio and these other derived Fibonacci numbers are 'special' numbers that form the Fibonacci retracement and extension levels. Whenever the fib tool is plotted on a significant price move, the Fibonacci retracement and extension levels are projected as important price levels where changes in direction of price movement should occur.
How is the Fibonacci Tool Plotted on a Price Move to Project Retracement and Extension Levels
Whenever the Fibonacci tool is plotted on a significant price move. It projects the retracement and extension levels based on the measured distance of the price move.
Draw the Fibonacci tool between the high and low end of a significant price move. This will project the retracement and expansion levels of these two points.
The retracement levels begin at 0%, followed by 23.6%, 38.2%, 50%, 61.8%,78.2% and then 100% which is the complete reversal of the original measured price move and the extension starts from 100%, followed by 1.618%, 2.618%, 4.236% and more.
Applications and Use Cases of the Fibonacci Tool
- Fibonacci Retracement and Extension Levels as Support and Resistance
The projected Fibonacci retracement and extension levels are static horizontal lines that allow for quick and easy identification of inflection points. A point where price movement can reverse or change the course of its direction.
Each of these levels is associated with a percentage that is derived from the relationship of the numbers in the Fibonacci sequence.
The Fibonacci retracement levels are 23.6%, 38.2%, 50%, 61.8%,78.6%.
The fibonacci extension levels are 1.618%, 2.618%, 4.236%
The 50% (midpoint) of the fib retracement levels is referred to as the equilibrium of a measured price move although it is not among the Fibonacci ratios but it is a potential price level for changes in the direction of price movement.
Image: Fibonacci Retracement Levels as Support and Resistance on EurUsd.
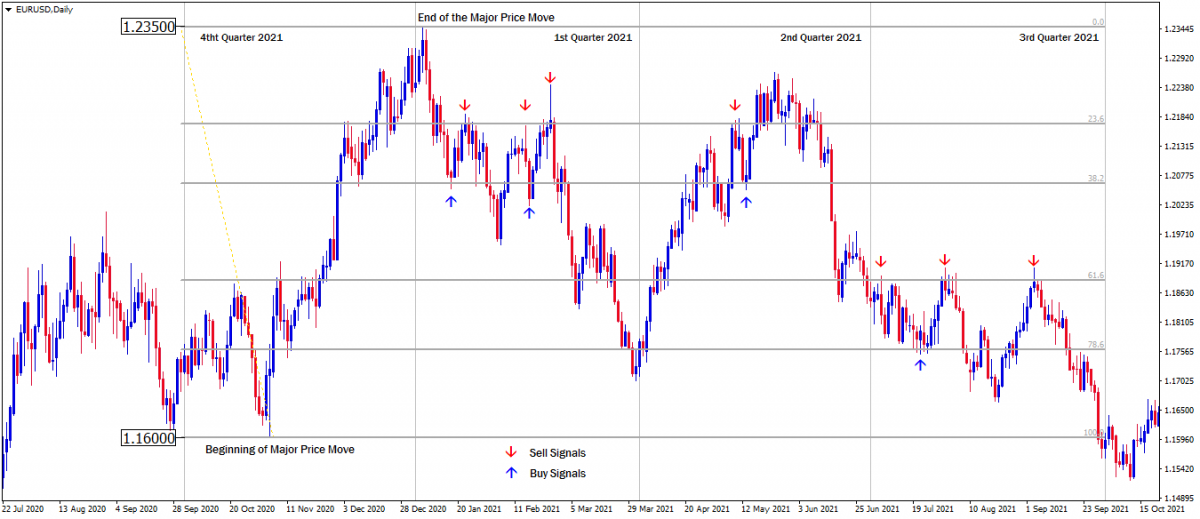
From the last quarter of 2020, Price rallied explosively from November into the January highs of 2021, covering a massive +700 pips between the 1.1600 to 1.2350 price level.
And then EurUsd have traded within this significant price range till the third quarter of the year 2021.
It can be seen how price movements have reacted to the Fibonacci retracement levels as support and resistance within the established price range.
Sell orders can be opened when price hit any of the fibonacci retracement levels from below as resistance and buy order can be opened when price hit any of the fibonacci retracement levels from above as support. But the trade ideas must be confirmed by other confluence signals.
Traders who took advantage of these opportunities profited massively with this strategy in the year 2021
- Fibonacci Extension Levels as Profit Targets
Fibonacci extension levels are external projections of the tool used to forecast the extent of successive price expansions that emanates from the retracement (or correction) of the initial price expansions.
The Fibonacci extension levels also act as support and resistance to price movement which makes it a high probability target for profit objectives.
How to use the Fibonacci extension levels in alignment with the retracement levels
Plot the fib from the beginning to the end of a significant price move.
Then customize the fibonacci extension levels to align with the fibonacci retracement levels of the measured price move with the following.
For profit target 1: Change [1.618] to [-0.618]
For profit target 2: Add [-1.0]
For profit target 3: Change [2.618] to [-1.618]
Although [-1.0] is not among the Fibonacci ratios, it projects an equal distance of the successive price expansion to the initial price expansion.
Examples of Bullish and Bearish Trade Setup With Fibonacci Extension Levels as profit targets.
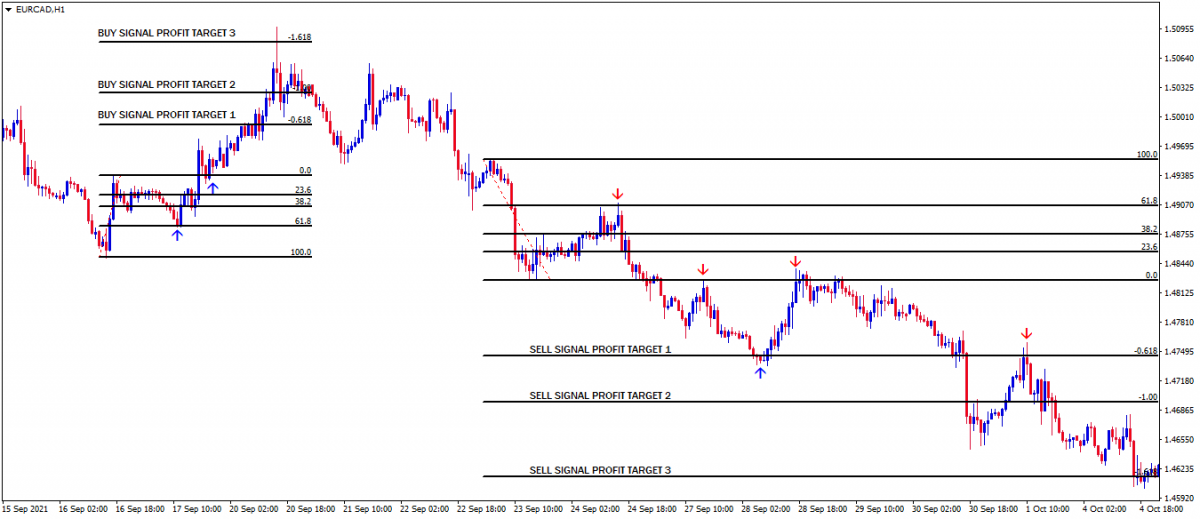
First Example is The Bullish Trade Setup
We can see a successive bullish price expansion from the 61.8% retracement level of the initial bullish move.
The high of the fib [0.0] can be seen acting as support as it propels the price move to its maximum profit objective at the 1.618% extension level.
Second Example is the Bearish Trade Setup
We can see a successive bearish price expansion from the 61.8% retracement level of the initial bearish move.
The low of the fib [0.0] can be seen acting as resistance as it propels price move to the first profit target at -0.618% expansion level.
The -0.618% expansion level can be seen acting as support and resistance until price reaches its potential profit target at -1.618%.
- Fibonacci Deep Retracement Levels in a Trending Market
- Identify a trend either bullish or bearish.
- Identify the most recent significant price move.
- Plot the Fibonacci tool from the beginning to the end of the price move.
- Delineate the upper half of the measured price move as premium, the midpoint as equilibrium and the lower half as discount.
In an uptrend, price movement makes higher highs and retracement (corrections) of higher lows.
Whenever price retraces below the 50% level (i.e. discount) of a significant bullish price expansion, the market is considered to be oversold.
Example of a Fibonacci Deep Retracement Bullish Setup in a Bullish Trend on the GbpUsd Weekly Chart
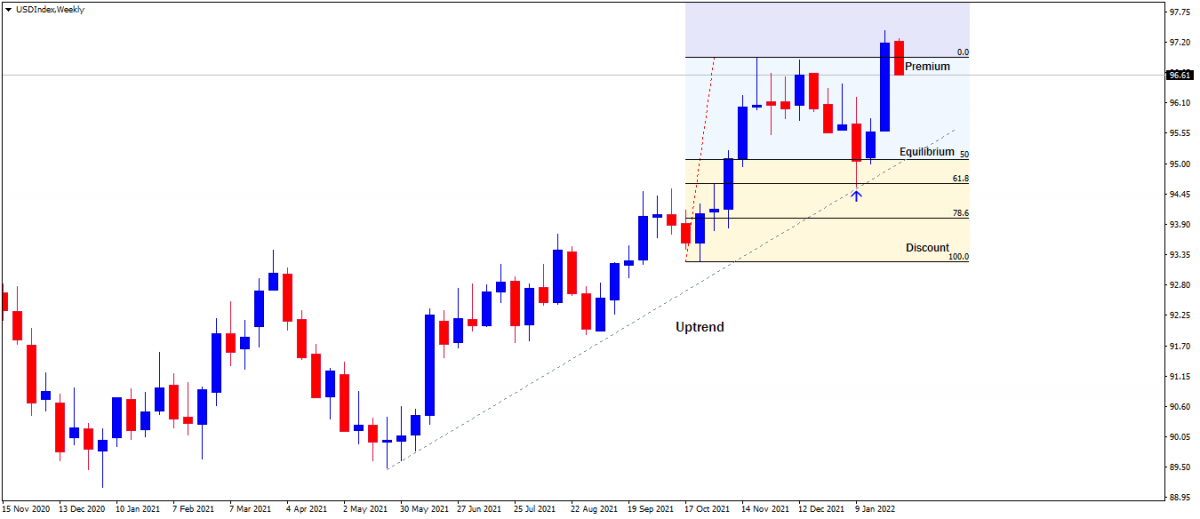
Since we're trading alongside the uptrend, buy signals should be anticipated at the 50% Equilibrium, or below at the 61.8% or 78.6% deep retracement levels. Hence, any long trade setup at this oversold or discount level will be highly probable.
In a downtrend, price movement makes lower lows and retracement (corrections) of lower highs.
Whenever price retraces above the 50% level (i.e. premium) of a significant bearish price move, the market is considered to be overbought.
Image Example of a Fibonacci Deep Retracement Bearish Setup in a Bearish Trend on the GbpCad Weekly Chart.
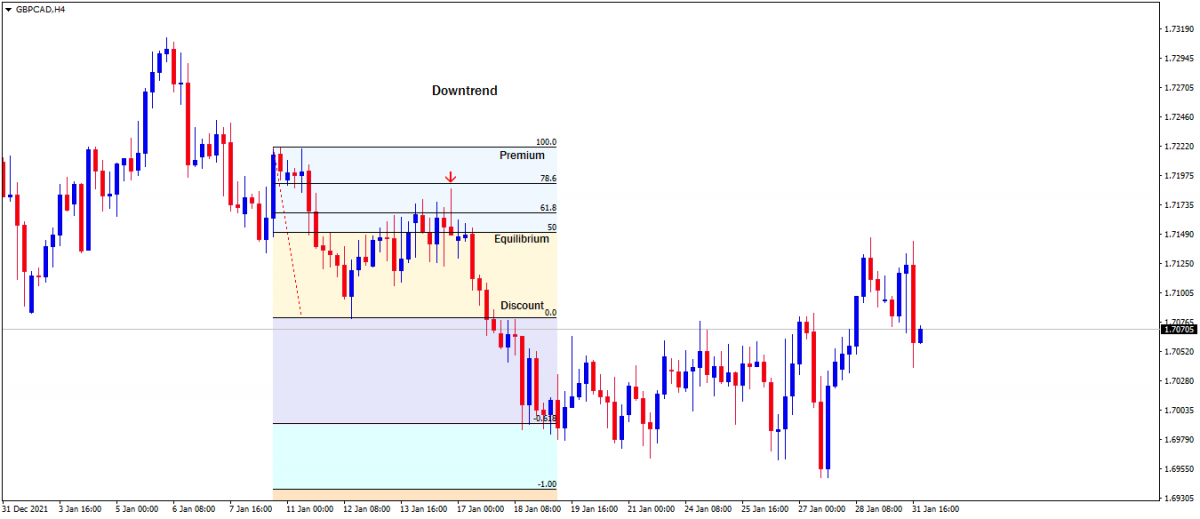
Since we're trading alongside the downtrend, sell signals should be anticipated at the 50% Equilibrium, or above at the 61.8% or 78.6% deep retracement levels. Hence, short trade setups at any of this overbought or premium level will be highly probable.
- Combination with Other Indicators Trading Strategy
The Fibonacci retracement and extension levels are very useful when in conjunction with a broader strategy.
Confluences of other technical indicators such as candlestick patterns, trendlines, volume, momentum oscillators, and moving averages increase the probability of price movement changing directions at the Fibonacci levels.
Generally, the more the confluences, the more robust the signal.
Confluence with the Bollinger Band Indicator
The Bollinger band indicator can be used in conjunction with the Fibonacci retracement and extension levels to confirm head-fake signals.
In an uptrend, if there is a head-fake at the lower line of the band when price is at any of the discount retracement levels. This signals a high probable buy setup.
Image Example of Bollinger Band Head-fake Signal in Confluence with the Fibonacci Retracement Levels on Dollar Index Daily Chart
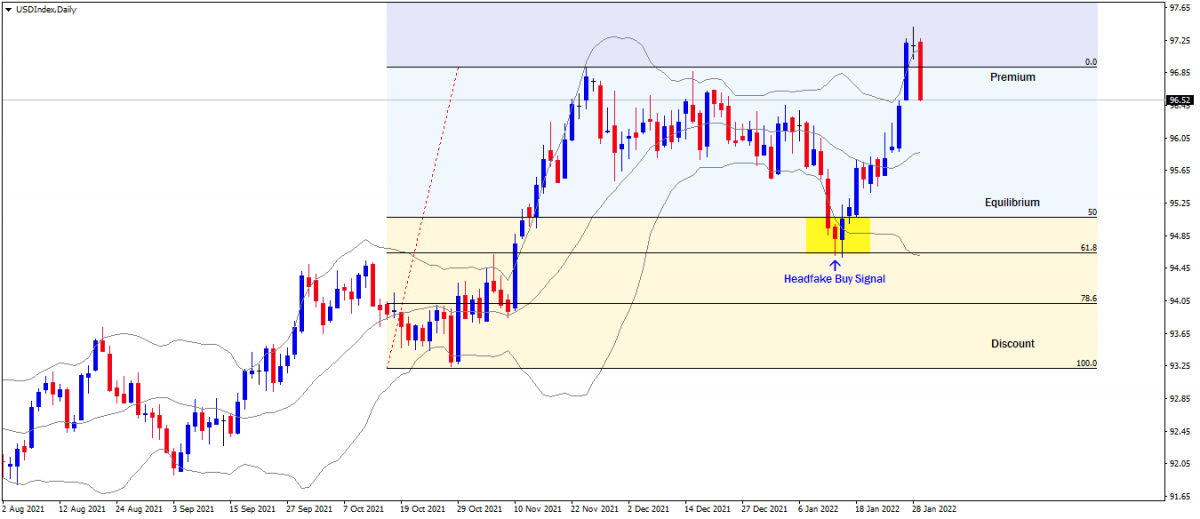
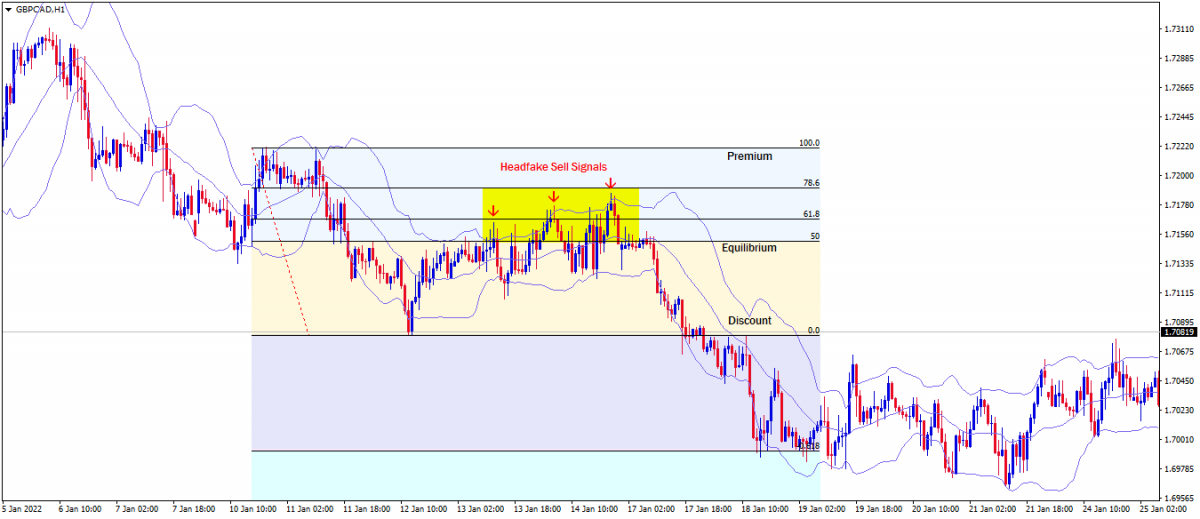
In a downtrend, if there is a head-fake at the upper line of the band when price is at any of the premium retracement levels. This signals a high probable sell setup.
Image Example of a Bollinger Band Head-fake Signal in Confluence with the Fibonacci Retracement Levels on GbpCad 4Hr Chart.
Confluence with Moving Averages as Dynamic Support and Resistance
Moving averages can be used to validate anticipated change in the direction of price movement at the Fibonacci retracement levels.
50 and 100 moving averages are used as dynamic support and resistance in confluence with the Fibonacci retracement level to confirm high probable setups.
Image Example of the 50 and 100 Moving Averages in Confluence with the Fibonacci Retracement Levels on the Dollar Index Daily Chart.
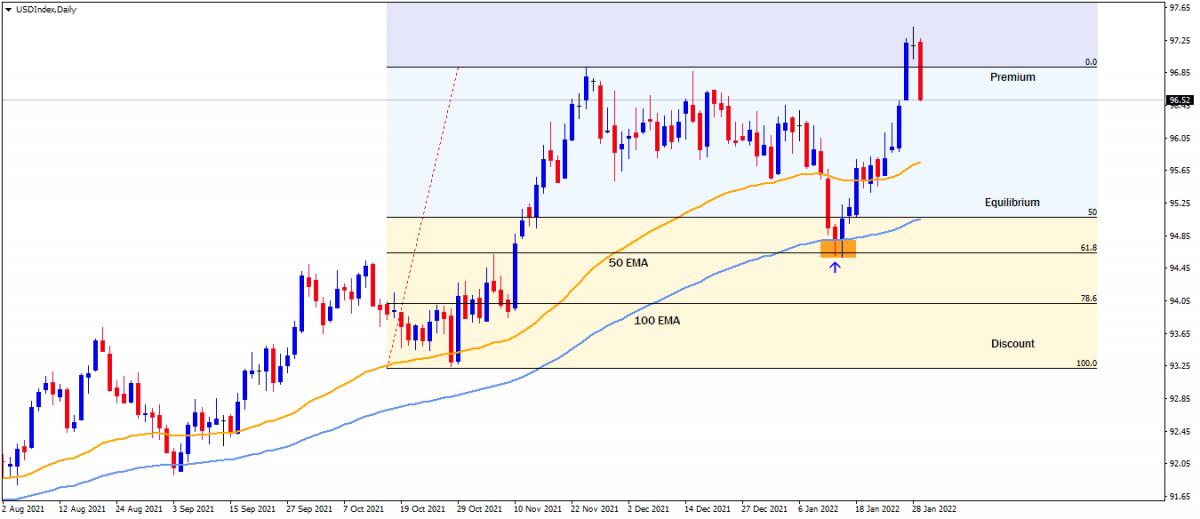
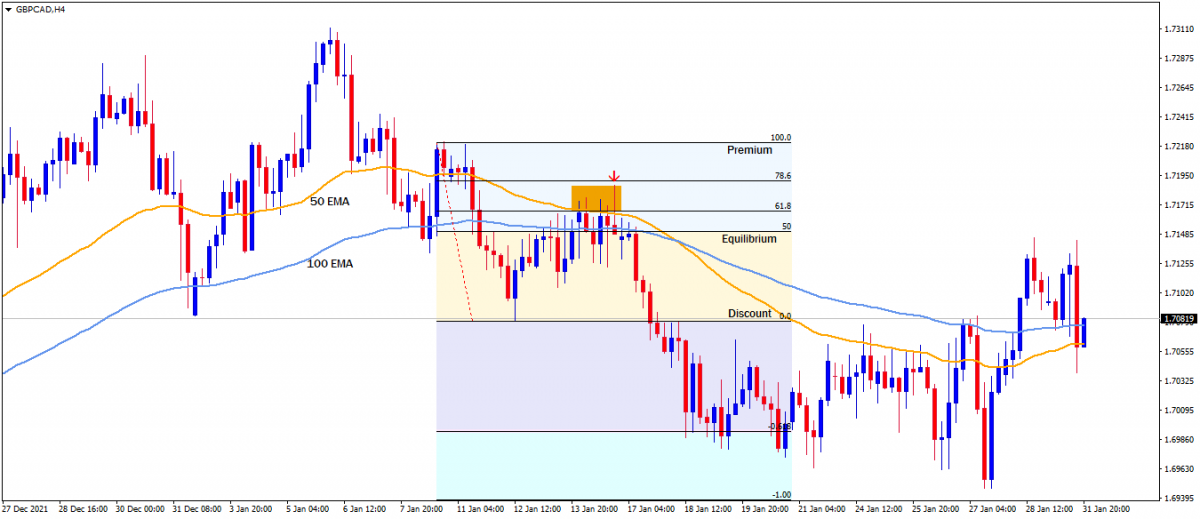
Image Example of the 50 and 100 Moving Averages in Confluence with the Fibonacci Retracement Levels on the GbpCad 4Hr Chart.
Confluence with Candlestick Entry Patterns
Candlestick patterns provide valuable insight into price movement at a glance. They tell the strength of price movement and also foretell future price moves. So therefore it is highly probable to use candlestick entry patterns as entry signals such as hammers, shooting stars, pin bars, bullish or bearish engulfing and so on.
We have covered a lot about the Fibonacci tool and the Fibonacci forex trading strategies. They are quite simple and less complicated strategies that can make everyone profitable and successful in forex trading.
You should feel comfortable practicing these strategies on a demo account before trading a live account.
Click on the button below to Download our "Fibonacci Forex Strategy" Guide in PDF
