Forex support and resistance strategy
Forex trading involves the buying and selling of currencies in the global foreign exchange market. Traders employ various strategies to capitalize on market fluctuations and generate profits. Among these strategies, support and resistance levels play a vital role in identifying potential entry and exit points for trades.
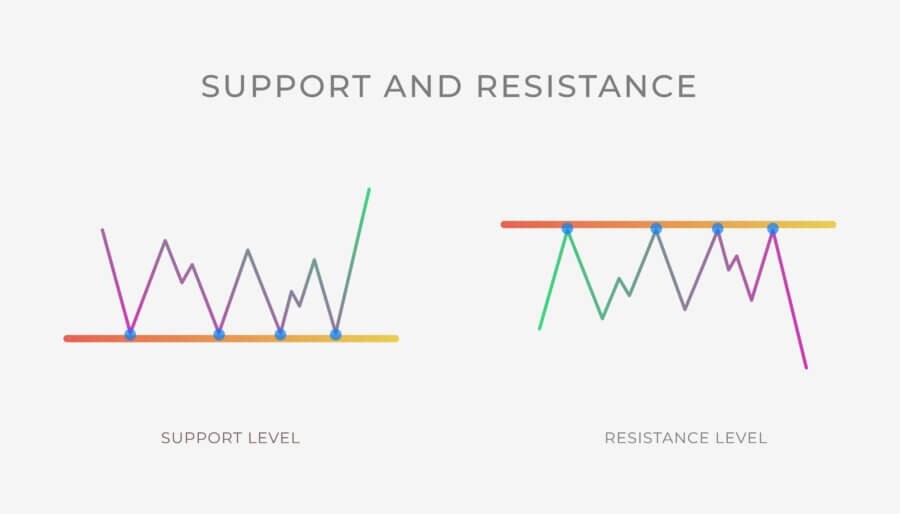
Support and resistance levels are key technical indicators used by forex traders to determine the levels at which the price of a currency pair is likely to encounter obstacles or reversals. Support levels represent areas where buying pressure exceeds selling pressure, causing prices to bounce back up. Conversely, resistance levels signify zones where selling pressure exceeds buying pressure, leading to price reversals or temporary halts.
Understanding and effectively utilizing support and resistance levels can provide traders with valuable insights into market trends, price reversals, and potential trade setups. It helps traders make informed decisions based on the historical behaviour of prices and market sentiment.
Understanding support and resistance in forex trading
Support and resistance levels are fundamental concepts in forex trading that help traders identify key price levels at which the market is likely to exhibit a significant response. Support refers to a price level where buying pressure surpasses selling pressure, resulting in a temporary halt or a rebound in prices. It acts as a floor, preventing prices from declining further. On the other hand, resistance represents a price level where selling pressure exceeds buying pressure, causing prices to stall or reverse. It acts as a ceiling, preventing prices from rising further.
To identify support and resistance zones, traders analyze historical price data and look for areas where prices repeatedly reverse or exhibit a strong reaction. These zones can be identified using various technical analysis tools such as trendlines, moving averages, Fibonacci retracements, and pivot points. Traders pay attention to significant price levels, swing highs, swing lows, and chart patterns that suggest the presence of support and resistance zones.
Interpreting support and resistance zones involves analyzing the strength and significance of these levels. Strong support or resistance is characterized by multiple price bounces or prolonged price congestion around a particular level. The more times prices react to a level, the stronger its significance. Traders also consider volume and order flow analysis to gauge the strength of support and resistance zones.
Role of support and resistance in determining market sentiment
Support and resistance levels play a crucial role in determining market sentiment. When prices approach support, it suggests that buyers are becoming more active, creating demand and potentially signaling a bullish sentiment. Conversely, when prices approach resistance, it indicates that sellers are gaining strength, creating supply and potentially signaling a bearish sentiment. The reaction of prices at support and resistance levels can provide insights into the balance between buyers and sellers and help traders gauge market sentiment.
Understanding support and resistance levels is essential for traders as they provide valuable information about potential entry and exit points, trend reversals, and areas of price congestion. Incorporating these concepts into a forex trading strategy can enhance decision-making and improve overall trading performance.
Implementing a support and resistance forex trading strategy
The support and resistance strategy is a popular approach among forex traders that capitalizes on the levels at which prices are likely to reverse or encounter obstacles. This strategy aims to identify key support and resistance levels to make informed trading decisions. By understanding the behaviour of prices around these levels, traders can anticipate potential entry and exit points, manage risk, and maximize profit potential.
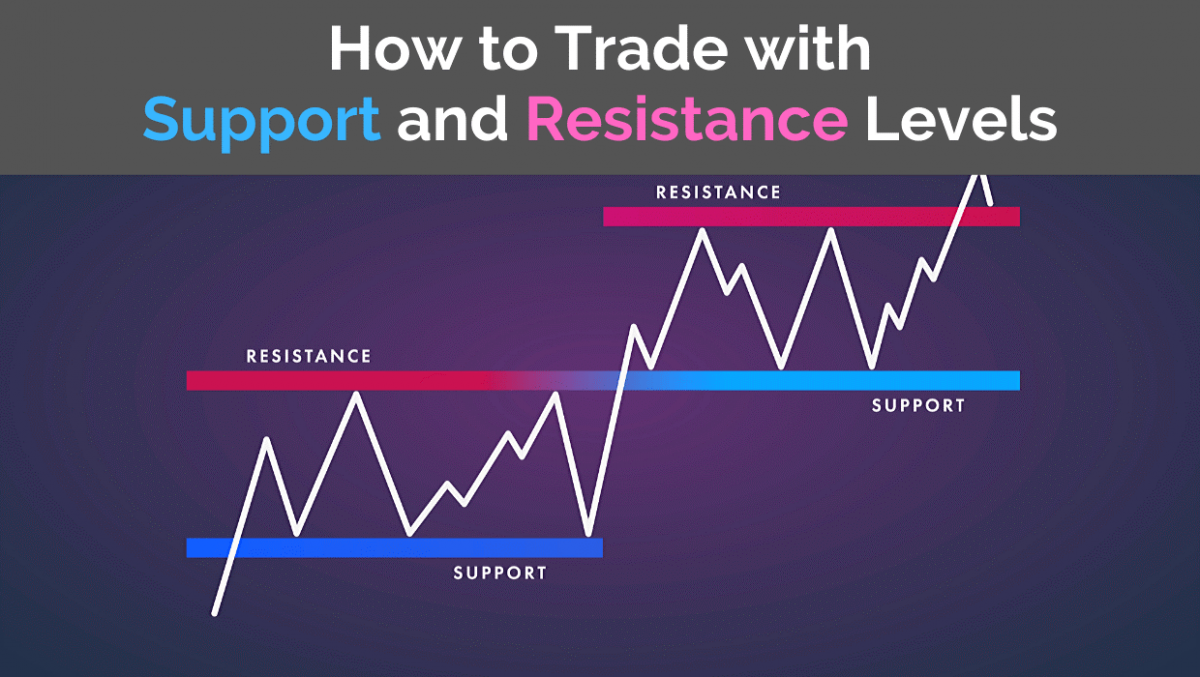
To implement the support and resistance strategy, traders follow a systematic process to identify and plot these critical levels. They analyze historical price data and look for areas where prices have shown significant reversals or congestion. Trendlines, moving averages, and chart patterns can be used to identify potential support and resistance zones. Additionally, traders consider horizontal levels such as previous swing highs and lows.
Once the levels are identified, traders plot them on their charts, creating visual reference points. This helps them monitor price action and make trading decisions based on the behaviour of prices around these levels.
Setting entry and exit points based on support and resistance
Support and resistance levels provide valuable insights for setting entry and exit points. When prices approach support, traders may consider initiating buy positions with the expectation of a bounce or reversal. Conversely, when prices approach resistance, traders may consider initiating sell positions with the expectation of a price decline or reversal.
Setting stop-loss orders slightly below support or above resistance levels helps manage risk by protecting against potential breakdowns or breakouts. Profit targets can be set based on nearby support or resistance levels or by using other technical analysis tools such as Fibonacci extensions or trend projections.
By incorporating support and resistance levels into their trading strategy, traders can effectively time their entries and exits, increasing the probability of successful trades and optimizing their overall trading performance.
Scalping support and resistance strategy
Scalping is a popular trading technique in the forex market that focuses on profiting from small price movements. It involves executing multiple trades within a short time frame, aiming to capture quick profits. Scalpers typically hold positions for minutes or even seconds, making it a fast-paced and dynamic trading style.
Support and resistance levels are valuable tools for scalpers as they provide crucial reference points for identifying potential price reversals and breakouts. Scalpers look for price reactions at these levels, seeking opportunities to enter trades when the price bounces off support or breaks through resistance.
When scalping, traders often utilize tight stop-loss orders to manage risk. By placing stop-loss orders slightly beyond support or resistance levels, they aim to minimize potential losses in case the price action does not follow their anticipated direction.
Fine-tuning the strategy for short-term trades
To optimize the support and resistance strategy for scalping, traders may use shorter time frames such as one-minute or five-minute charts. These shorter time frames allow for better precision in identifying support and resistance levels and capturing quick price movements.
In addition, scalpers may consider incorporating other technical indicators, such as oscillators or momentum indicators, to confirm potential trade setups. These indicators can provide supplementary signals to support the decision-making process, enhancing the accuracy of scalping trades.
Successful scalping requires discipline, quick decision-making, and efficient execution. Traders must closely monitor price movements and be prepared to enter and exit trades swiftly based on the behaviour of prices around support and resistance levels.
By combining the fast-paced nature of scalping with the insights provided by support and resistance levels, traders can potentially capitalize on short-term opportunities and generate consistent profits in the forex market.
Tools and indicators for support and resistance trading
Forex indicators are powerful tools that assist traders in identifying and interpreting support and resistance levels. These indicators utilize mathematical calculations and historical price data to generate visual representations of support and resistance zones. They provide traders with additional insights and confirmation of potential trade setups.
Moving Averages: Moving averages are widely used to identify support and resistance levels. Traders often focus on key moving average periods such as the 50-day or 200-day moving averages. When prices consistently bounce off or break through these moving averages, it indicates the presence of support or resistance.
Pivot Points: Pivot points are calculated based on previous day's high, low, and close prices. They provide traders with multiple support and resistance levels for the current trading day. Pivot points help identify significant price levels where reversals or breakouts are likely to occur.
Bollinger Bands: Bollinger Bands consist of an upper band, lower band, and a central moving average. The upper band represents potential resistance, while the lower band indicates potential support. Bollinger Bands expand and contract based on price volatility, providing valuable information on potential price reversals or breakouts.
Combining multiple indicators for improved accuracy
Traders often combine multiple indicators to enhance the accuracy of support and resistance trading. By utilizing a mix of indicators that complement each other, traders can filter out false signals and identify high-probability trade setups. For example, combining moving averages with Bollinger Bands can provide confirmation of support or resistance levels.
It is important for traders to experiment with different indicators and find the combination that works best for their trading style. However, it is crucial to avoid excessive reliance on indicators and maintain a holistic view of market dynamics.
By leveraging the power of support and resistance indicators, traders can gain a comprehensive understanding of market behaviour, improve timing in their trades, and increase the likelihood of successful outcomes.
Developing a support and resistance expert advisor for MT4
Expert Advisors (EAs) are automated trading systems that execute trades on behalf of traders based on predefined rules and algorithms. They operate within popular trading platforms like MetaTrader 4 (MT4) and aim to eliminate human emotions and biases from trading decisions. EAs offer traders the ability to implement complex strategies, including support and resistance trading, without manual intervention.
Developing a support and resistance EA requires careful consideration of programming principles and trading logic. The EA should be designed to identify and react to support and resistance levels by analyzing price data and indicators in real-time. It should have the capability to plot support and resistance zones, execute trades at appropriate levels, and manage risk through features like stop-loss and take-profit orders.
To program the EA, traders can use MQL4, the programming language specific to MT4. They need to define the rules for identifying support and resistance levels, determining entry and exit points, and managing trade parameters. It is essential to optimize the code for efficiency and avoid common pitfalls such as overfitting or excessive complexity.
Testing and optimizing the EA for effective trading
After programming the support and resistance EA, thorough testing is crucial to ensure its effectiveness. Traders can use historical data to backtest the EA and assess its performance under various market conditions. This helps identify potential flaws and fine-tune the trading logic.
Optimization involves adjusting the EA's parameters and settings to maximize performance. Traders can use optimization tools within MT4 to test different combinations and find the optimal configuration for their chosen support and resistance strategy.
Additionally, forward testing the EA on a demo or live account allows traders to evaluate its performance in real-time market conditions. Monitoring key performance metrics like profitability, drawdown, and risk-reward ratio helps validate the EA's viability.
By developing and optimizing a support and resistance EA for MT4, traders can automate their trading strategy, increase efficiency, and potentially improve overall trading results.
Conclusion
Support and resistance levels serve as invaluable guides for traders, providing key reference points for identifying potential reversals, breakouts, and trade setups. By incorporating support and resistance analysis into their trading strategies, traders can make informed decisions, improve timing, and increase the accuracy of their trades. This can ultimately lead to better risk management and more consistent profitability.
Moreover, the integration of support and resistance analysis with other technical indicators and fundamental analysis can provide a comprehensive approach to trading. The ongoing research and development in this field hold the potential for innovative strategies and techniques that further enhance traders' ability to navigate the forex market successfully.
In conclusion, a solid understanding and application of support and resistance levels are essential for any forex trader. By incorporating these concepts into trading strategies and utilizing the right tools and indicators, traders can improve their decision-making process, enhance trading performance, and ultimately achieve long-term success in the dynamic world of forex trading.
