How to use MACD in forex trading
Forex traders utilize technical indicators to analyze market data and detect potential trading opportunities through the MACD (Moving Average Convergence Divergence) indicator. The MACD indicator stands as a leading tool among Forex traders because it helps analyze price momentum and trend direction. The indicator presents both trend-following and momentum analysis through a visual display of price strength and direction changes.
Forex traders depend on MACD because it provides both reliability and simplicity when used properly. The indicator depends on two exponential moving averages (EMAs) of price with periods set at 12 and 26 and a third signal line which uses a 9-period EMA of the MACD line. The resulting histogram provides additional insight into momentum shifts. The indicator's components function together to help traders detect important signals including crossovers and divergences which may indicate entry or exit points.
A trader observes a currency pair when the MACD line crosses above the signal line. The signal indicates bullishness under specific market conditions. The MACD system functions independently yet traders should use it as part of a complete trading strategy. The indicator reaches its maximum effectiveness when traders use it within a comprehensive strategy which includes risk management and multiple indicator confirmation.
What is MACD?
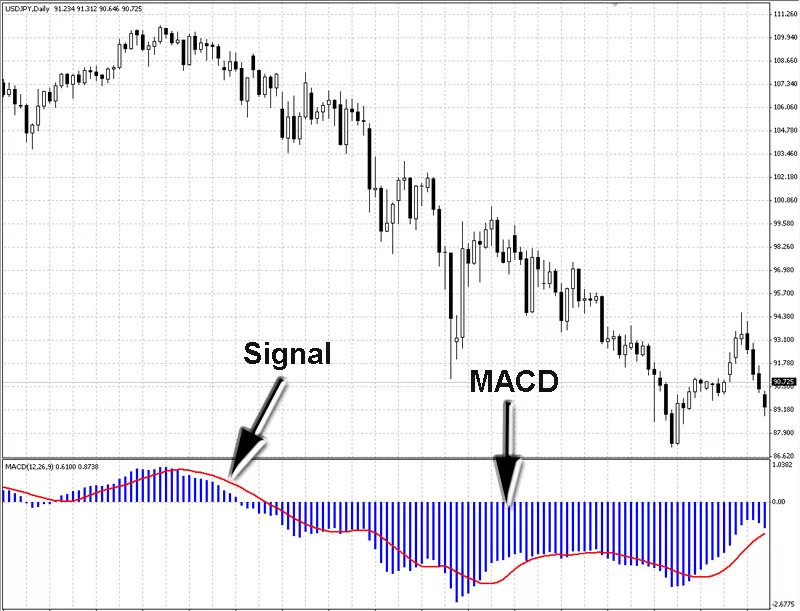
The Moving Average Convergence Divergence indicator known as MACD functions as a technical tool to assess price momentum and market trend direction. The indicator uses two exponential moving averages with time periods of 12 and 26 periods to establish its calculations. The MACD line results from subtracting the 26-period EMA from the 12-period EMA. The MACD indicator features a signal line which represents a 9-period EMA of the MACD line to generate buy or sell signals.
The 12-period EMA shows faster price reaction compared to the 26-period EMA. The MACD line indicates rising bullish momentum when the 12-period EMA outpaces the 26-period EMA. A MACD line that crosses above the signal line indicates an upward momentum shift. The bearish pressure becomes stronger when the MACD line crosses below the signal line.
The MACD histogram serves as a vital indicator component which displays the space between the MACD line and the signal line. The distance between the MACD line and the signal line expands when momentum grows but decreases when momentum weakens. The shrinking histogram bars following a bullish crossover indicate that buying strength is decreasing.
The indicator components function as a system to help traders determine if market trends are strengthening or weakening. The MACD indicator reacts to price movements but it does not generate predictions about future price directions. The distinction between indicator signals and market conditions helps traders establish appropriate expectations.
How MACD works
The MACD indicator calculates its values by determining the distance between two specific moving averages which are the 12-period and 26-period exponential moving averages (EMAs). The MACD line develops from the subtraction between these two EMAs. The MACD line crosses above or below the zero line based on whether the short-term EMA outperforms or underperforms the long-term EMA. The 12-period EMA responds faster to price increases which causes the MACD line to move above the zero line. The MACD line drops below zero when prices experience downward movement.
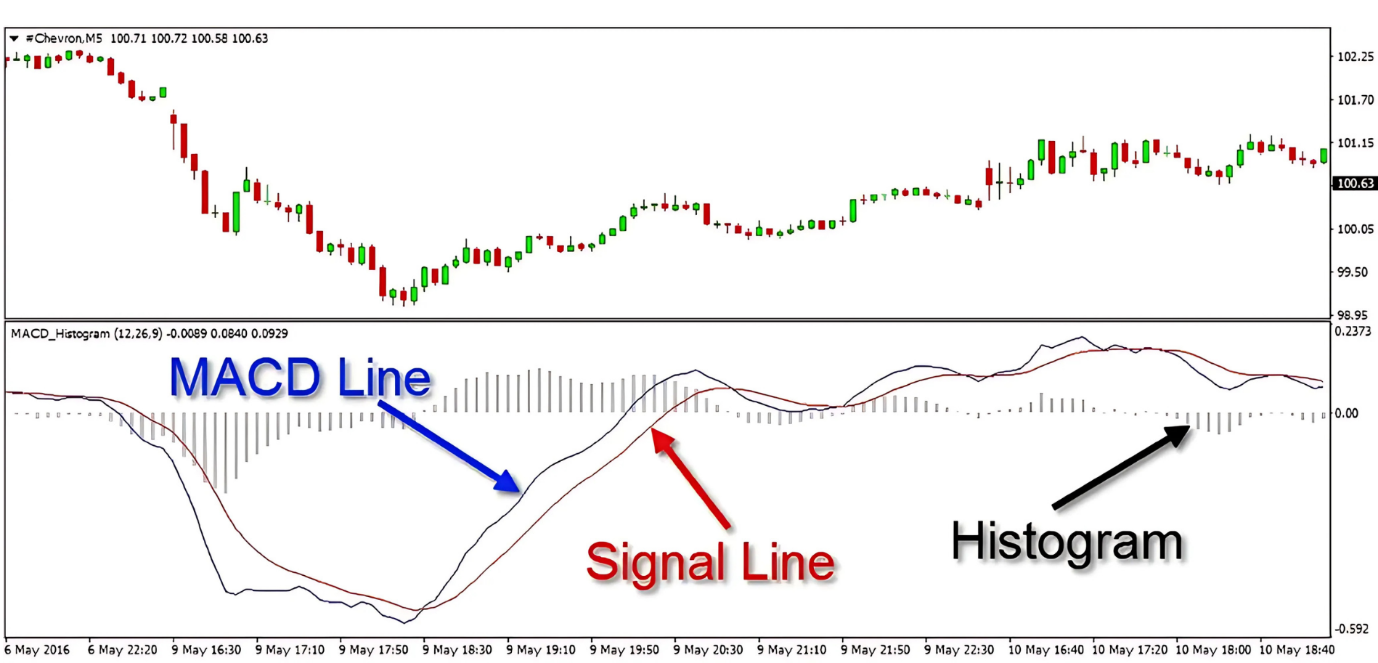
The signal line functions as a 9-period EMA of the MACD line. The signal line functions to reduce MACD's rapid movements while helping traders detect momentum changes. The MACD line crosses above the signal line. This might suggest that upward momentum is increasing. The MACD line crossing below the signal line indicates bearish momentum is increasing.
The histogram displays vertical bars which represent the difference between the MACD line and the signal line. The height of the bars increases when the distance between the lines expands but decreases when the lines move closer together. The histogram will show a steady upward trend when the market experiences a strong bullish movement. The shrinking bars serve as an early warning sign that momentum is decreasing although the trend has not turned yet.
Key MACD trading signals
The MACD system produces multiple types of signals which enable traders to determine market momentum as well as identify entry and exit opportunities. The main signals traders use from MACD include signal line crossovers and zero line crossovers together with divergence between price and the MACD line. The signals produce distinct market implications which depend on both time frame and market conditions.
The MACD line crosses over the signal line to create a signal line crossover. The MACD line crosses above the signal line. The rising upward momentum might indicate to traders that this situation represents a possible buying opportunity. The MACD line crossing below the signal line indicates bearish momentum is increasing which may create a sell setup.
The zero line crossover serves as an additional tool to verify market trend direction. The MACD line crossing above the zero line indicates the 12-period EMA has surpassed the 26-period EMA thus signaling a bullish trend shift. A MACD drop below the zero line indicates a possible bearish trend.
Traders frequently monitor the signal produced by MACD price divergence. The formation of higher price highs alongside lower MACD highs creates bearish divergence which indicates declining upward market momentum. The formation of bullish divergence occurs when price creates lower lows while the MACD generates higher lows which indicates declining bearish strength.
Customizing MACD settings for different strategies
The standard MACD settings (12, 26, 9) serve as a base for traders who want to adjust these inputs according to their trading approach and market environment. The ability to customize MACD parameters allows traders to achieve better alignment between their trading strategy and their preferred timeframes and asset volatility levels and risk tolerance.
A trader who operates in short-term intraday markets should consider this information. A 6, 13, 5 setting will produce signals earlier than usual which helps traders detect fast market movements. The increased sensitivity from using fast settings produces more noise while generating additional false signals. Position traders who analyze daily charts tend to use slower MACD settings at 19, 39, 9 because these settings produce fewer signals yet deliver more reliable results.
The selection of MACD settings through historical data analysis reveals which configuration matches the trading strategy best. A trader who studies GBP/USD on a 1-hour chart will discover that the MACD configuration 8, 21, 5 delivers superior signal quality during London and New York trading hours.
The success of MACD analysis depends on maintaining consistent settings. Using the same set of parameters for all trades simplifies performance evaluation and enables traders to make better adjustments. Traders should observe how their customized MACD interacts with other indicators including moving averages and volume-based tools to prevent duplicate signals or conflicting market interpretations.
How to use MACD in a forex trading strategy
The implementation of MACD in trading strategies requires traders to detect momentum changes while matching market trend signals. Traders achieve better trading outcomes through MACD crossovers and divergence signals when they incorporate additional confirmation tools into their strategies.
The EUR/USD 4-hour chart shows the MACD line crossing above the signal line. A bullish crossover indicates that traders should consider opening long positions. The reliability of this setup improves when traders use support levels together with RSI confirmation. The trading opportunity becomes stronger when the crossover happens near a defined support zone while RSI moves from an oversold position.
The selection of timeframes plays an essential role in MACD implementation. The 15-minute time frame produces multiple signals but these signals contain high levels of market noise. The MACD indicator produces fewer yet more reliable signals when traders use daily or 4-hour chart timeframes. Daily chart bullish MACD crossovers indicate trend reversals that extend beyond short-term retracements.
Traders use MACD together with moving average envelopes and trendlines and Fibonacci retracement levels to enhance their trading decisions. The combination of tools helps traders define better exit strategies. Traders typically exit their long positions when the MACD line crosses below the signal line or when price approaches resistance.
Advantages and limitations of MACD
Forex traders who want to analyze momentum and trend direction through structured visual methods find multiple benefits in using MACD. The indicator stands out because it unites trend-following analysis with momentum evaluation into a single indicator. The indicator provides dual functionality to detect price behavior changes which basic price action analysis might miss.
A trader can use a bullish MACD crossover to confirm price behavior shifts when the MACD line crosses above the zero line. Such signals become more probable when the market is trending because they receive additional support from technical levels.
The indicator MACD works effectively across various time intervals. MACD functions effectively on both short-term 15-minute charts for day trading and longer-term daily charts for swing trading without requiring major adjustments.
However, MACD also has limitations. The indicator uses historical price data to generate its lagging signals. The indicator generates signals after price movements have already started. Fast market conditions can cause bullish MACD crossovers to appear after most of the price increase has occurred which results in delayed market entries.
The indicator produces incorrect signals when markets experience flat or unpredictable price movements. The occurrence of multiple crossovers during periods of market stagnation can lead to trading losses unless traders implement additional analytical methods. Traders who want to reduce false signals use MACD in combination with support/resistance zones and price patterns and volatility filters.
Common mistakes to avoid when using MACD
The incorrect use of MACD across trading platforms results in suboptimal trading choices. The most common mistake traders make involves depending only on MACD signals without verifying them through other tools and market conditions. The entry of long positions based on bullish crossovers during downtrend conditions leads to premature market entries and potential trading losses.
The incorrect interpretation of divergence stands as one of the common problems traders face. The price creates a higher high while the MACD line produces a lower high. The bearish divergence indicates weakening momentum yet it does not guarantee an immediate market reversal. When traders base their decisions solely on divergence without additional confirmation such as support level breaks or trend structure changes they risk premature exits and unprofitable trades.
The effectiveness of MACD declines when traders apply it to inappropriate time periods. The 5-minute and 15-minute charts generate many unreliable MACD signals because of market noise which affects lower timeframes. The increased number of false positives becomes a risk factor. The effectiveness of the indicator improves when traders match it with timeframes which match their trading strategy to eliminate random market movements.
The failure to implement risk management strategies represents another major problem. Valid MACD signals become risky when traders enter positions without establishing stop-loss rules and position size limits. A structured trading approach which combines MACD signals with risk controls and multiple confirmation tools produces more reliable trading results.
Conclusion
Forex traders need to implement a systematic analytical process to effectively utilize MACD indicators. The indicator shows momentum and trend shift patterns yet it does not generate future predictions independently. The most successful trading outcomes result from using MACD as part of a complete trading strategy which combines market structure analysis with confirmation tools and strict risk management protocols.
A bullish MACD crossover appears on the 4-hour chart. Before making any trading decision traders should examine if price approaches a demand zone while showing strength against the US Dollar Index. When multiple indicators match the trade becomes more dependable. The combination of multiple analysis layers decreases false signal occurrences which leads to improved trading decisions.
Traders should practice with demo accounts to learn how MACD indicator behaves across various currency pairs and market situations. The process of backtesting particular trading setups which include signal line crossovers during pullbacks in uptrends allows traders to identify patterns that match their preferred trading approach. The combination of MACD with RSI produces superior results in trending markets compared to ranging markets.
The process of trading success depends on establishing specific rules for entering trades and exiting positions and determining position sizes. The trader needs to determine both stop-loss order placement locations and profit-taking points. Traders use two different methods to exit trades by waiting for the MACD line to cross below the signal line or by targeting prices at previous support and resistance levels.
