How to use the Relative Strength Index (RSI) in forex
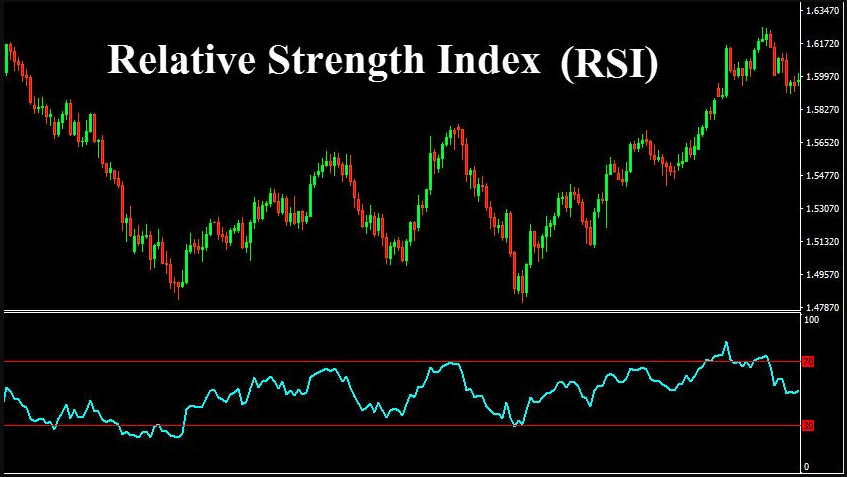
The Relative Strength Index (RSI) functions as one of the most widely used momentum indicators which technical analysts employ to analyze forex markets. The RSI indicator moves between 0 and 100 while most trading platforms display it below price charts.
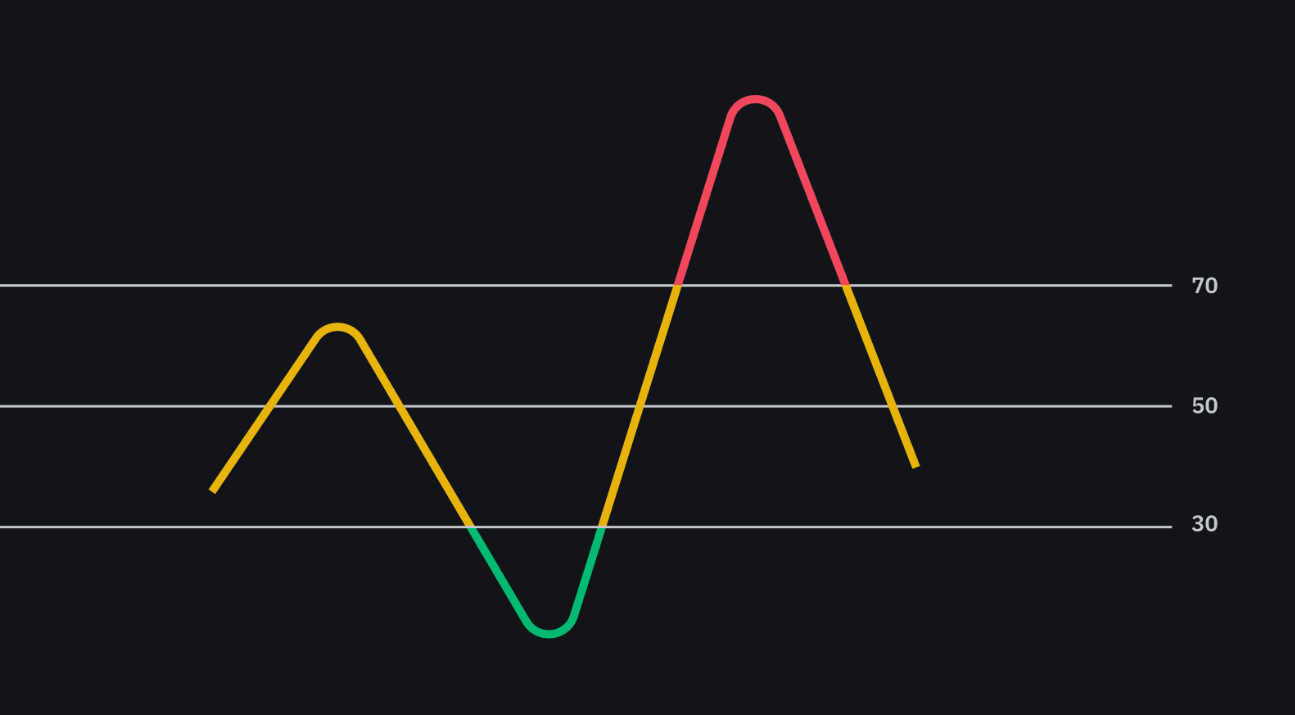
The RSI serves forex traders as a tool to identify suitable entry and exit opportunities. The RSI indicator signals potential price pullbacks when it exceeds 70 because this indicates the currency has reached overbought levels. The pair shows signs of being oversold when RSI falls below 30 which might lead to a price rebound. The signals from RSI do not function as individual buy or sell instructions. Traders should validate RSI signals by checking price movements together with support/resistance levels and moving averages.
What is the Relative Strength Index (RSI)?
The Relative Strength Index (RSI) functions as a technical indicator which measures both the speed of price movements and their changes. The momentum oscillator indicator exists between 0 and 100 on its scale. J. Welles Wilder Jr. developed RSI in 1978 to assist traders in finding potential reversal points through the comparison of recent gains against recent losses across a standard 14-period window.
The RSI calculation uses the following mathematical formula:
RSI = 100 - [100 / (1 + RS)], where RS represents the ratio of average gains to average losses within the specified period. Most trading platforms automatically calculate RSI but understanding its operation enhances the comprehension of market reaction patterns.
The EUR/USD price increase during the last 14 hours on an hourly chart leads RSI to rise which indicates positive market momentum. The pair becomes overbought when RSI exceeds 70. The pair enters an oversold state when its value drops below 30. These levels function independently from buy or sell signals. RSI stays elevated above 70 or depressed below 30 for long stretches during strong market trends.
How RSI works in forex
The Relative Strength Index (RSI) in forex trading helps traders find trading opportunities through its ability to detect when currency pairs reach overbought or oversold levels. The indicator operates between 0 and 100 while using a standard 14-period timeframe. The indicator indicates overbought conditions when RSI exceeds 70. The indicator shows oversold conditions when RSI drops below 30. The thresholds function as warning indicators which traders must interpret before taking any action.
The RSI reading on the USD/JPY 4-hour chart shows 75 which indicates the pair has experienced a strong upward move during its last 14 periods. The indicator does not automatically indicate that a reversal will occur. RSI levels stay high during long periods of strong market trends. The combination of RSI with moving averages provides traders with better understanding of market conditions.
The RSI midpoint at level 50 serves as a key indicator for traders. The indicator shows growing bullish momentum when it crosses above 50 but indicates bearish conditions when it crosses below 50. The midpoint functions as a confirmation point for trends when traders use daily charts and other higher timeframes.
Strategies for using RSI in forex trading
The Relative Strength Index (RSI) enables traders to execute multiple structured trading strategies that help them detect price reversals and continuation signals and momentum shifts. The overbought/oversold strategy represents a widely used method. The EUR/USD 1-hour chart shows an RSI reading of 80 which indicates the pair has reached an overbought state and may experience a price correction. The signal alone does not provide sufficient evidence for traders to take action since it needs additional confirmation. Traders typically monitor RSI when it falls below 70 while also checking for candlestick patterns and resistance levels.
The effective trading method relies on divergence analysis. A bearish divergence appears when GBP/USD price makes a higher high but RSI shows a lower high which signals declining momentum. The trend continuation signal emerges from hidden divergence patterns when price creates higher lows while RSI produces lower lows especially during uptrend conditions.
The analysis of RSI trendline breaks provides traders with additional information. The RSI chart trendline allows traders to detect price movements before they happen by monitoring its breakouts. The USD/CHF price demonstrates an upward trend until RSI breaks through its established trendline. The indicator serves as a preliminary indicator for potential momentum deterioration.
Common mistakes to avoid
The Relative Strength Index (RSI) serves as a popular tool for identifying price reversals and market momentum but its effectiveness decreases when traders make specific interpretation mistakes. Traders who depend solely on RSI for trade signals without extra verification tend to make this common mistake. Some traders make the mistake of attempting short positions when RSI exceeds 70 on the trending AUD/USD pair. Strong market trends cause RSI indicators to stay in overbought territory for prolonged periods. The use of price breakdowns through support levels as supporting signals helps traders avoid early market entries.
The use of RSI as a standalone indicator during high-volatility events such as central bank announcements or non-farm payroll releases represents another common mistake. The RSI indicator shows a reading below 30 when the Federal Reserve makes an interest rate decision. The short-term market volatility might be misinterpreted as an actual oversold condition
The practice of optimizing RSI settings for particular pairs and timeframes represents a widespread mistake among traders. The modification of RSI from 14 to 6 periods for increased signal frequency results in additional incorrect trading signals. Shorter RSI settings work well for scalping but traders need to evaluate them across different market conditions.
The failure to consider the overall trend direction results in trading against the market trend. The reliability of RSI readings increases when they match the dominant trend and moving averages or chart structure confirm the alignment.
Adjusting RSI settings for forex
The RSI indicator operates with a default period value of 14 regardless of the chosen time unit which includes minutes, hours or days. The standard RSI configuration works for numerous forex instruments yet specific trading methods and currency pairs might achieve better results through customized settings. The indicator sensitivity to price movements changes when traders modify the number of periods used. The RSI indicator with a period of 7 shows fast responses to current price movements which makes it suitable for scalpers and day traders. The RSI indicator with a period of 21 generates more stable signals for position and swing traders because it reduces noise in the data.
The EUR/USD currency pair is analyzed on a 1-hour chart through the RSI(14) indicator. The indicator will display overbought and oversold conditions more often when traders use RSI(7 instead of the standard RSI(14). The indicator produces additional trading opportunities but also generates additional incorrect signals.
Currency volatility also plays a role. GBP/JPY demonstrates greater daily price fluctuations than EUR/CHF. The use of longer RSI periods on volatile pairs helps minimize the occurrence of premature signals. The behavior of RSI changes when traders switch between different timeframes. The RSI indicator maintains its value above 70 for longer periods on a 4-hour chart than on a 5-minute chart for the same currency pair because of the broader price structure.
The adjustment of RSI parameters should occur through strategy objectives and market conditions and backtesting results instead of attempting to match individual trades after they occur.
RSI in different market conditions
The Relative Strength Index (RSI) effectiveness depends on the specific market conditions that exist in the trading environment. RSI proves useful in ranging markets because it helps traders identify potential reversal points at support and resistance levels. The EUR/CHF currency pair exists between 1.0650 and 1.0750. A reading of RSI below 30 near the lower price boundary indicates the pair has reached an oversold state which could trigger a price increase. A reading of RSI at 70 near the upper price range indicates a potential pullback might occur.
The approach to RSI usage differs between trending and ranging markets. Strong trends cause RSI to stay in overbought or oversold territory for multiple market sessions. The USD/JPY pair experiences a long-term upward trend which keeps RSI values above 70 for multiple trading days without any sign of reversal. RSI midline (50) functions as a trend filter during this scenario to generate more dependable signals. The price momentum remains bullish when RSI readings stay above 50 but turns bearish when readings fall below 50.
The time of day affects how RSI signals behave in the market. The RSI produces more responsive signals during the London and New York trading sessions because these periods have higher trading volumes and volatility. The Asian session produces less reliable signals on European or North American pairs because of reduced market liquidity.
Conclusion
The Relative Strength Index (RSI) functions as an adaptable instrument to assess market momentum together with potential reversals and trend confirmation. The signals generated by RSI through overbought/oversold levels and midline crossovers and divergence patterns make it an essential component of various forex strategies. RSI functions independently as a standalone solution. The combination of RSI with moving averages and price action analysis and support and resistance levels enhances the ability to detect reliable market entries and exits.
The analysis of RSI signals across different timeframes between 1-hour and 4-hour charts provides traders with a more complete understanding of market trends. Risk management stands as a fundamental requirement for all indicators. Traders should define their stop-loss levels in advance while using proper position sizing to control the amount of losses when trades fail to succeed. A trading plan that incorporates RSI enables traders to make decisions through technical analysis combined with strict execution protocols.
