How to use volume profile and market profile in FX
Price movement in foreign exchange reflects a continuous interaction between buyers and sellers. Through Volume-based analysis traders can identify trading activity centers which display price behavior patterns at specific market levels. The FX system operates through different channels than centralized markets because its trading activities occur across various market platforms. The trading community uses proxy data from tick activity and aggregated pricing feeds because there is no official volume figure available.
The Volume Profile and Market Profile systems transform market actions into organized statistical information. The system divides traded prices into three zones which show market acceptance and rejection and price imbalances. The EUR/USD exchange rate shows restricted price fluctuations which occur throughout all market segments. The Profile tools reveal how market transactions distribute across the price range which helps users determine if prices are at reasonable levels or have moved beyond typical ranges.
Understanding volume in the decentralized FX market
Unlike futures or equities, the foreign exchange market has no central exchange that records total traded volume. The trading process happens through banks together with liquidity providers and electronic communication networks and retail platforms. As a result, FX volume is estimated using tick data, which measures how often prices change rather than the exact number of contracts traded. Research shows that tick volume closely correlates with actual traded volume in highly liquid currency pairs.
Let’s say EUR/USD moves actively during the London session. The number of price updates at higher levels shows that institutions together with short-term traders are actively participating in the market. The trading activity tends to occur when market conditions produce narrow price differences and reduced trading expenses and better market pricing efficiency. The risk calculation process becomes more dependable when trading one standard lot because one pip equals ten US dollars because higher volume conditions minimize slippage.
Volume does not replace margin, leverage, or position sizing rules. The information serves to establish background details. Price level analysis helps traders develop improved trading systems which enable them to manage market risks when trading in different market conditions.
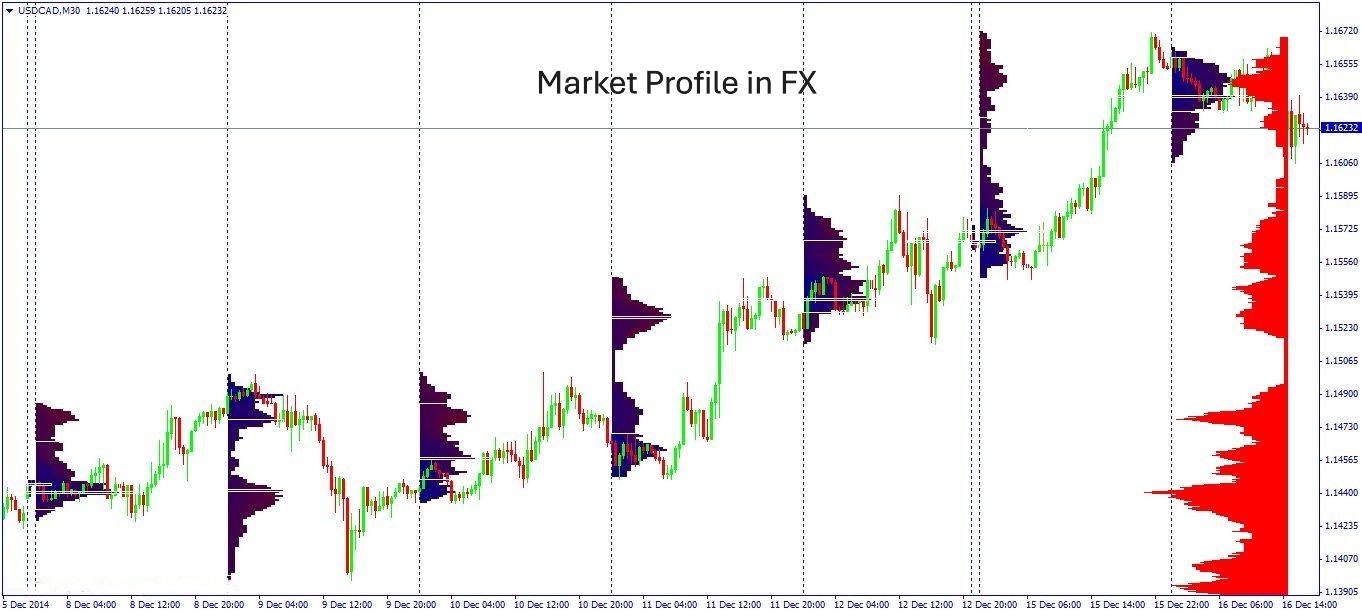
What is volume profile and why it matters in FX
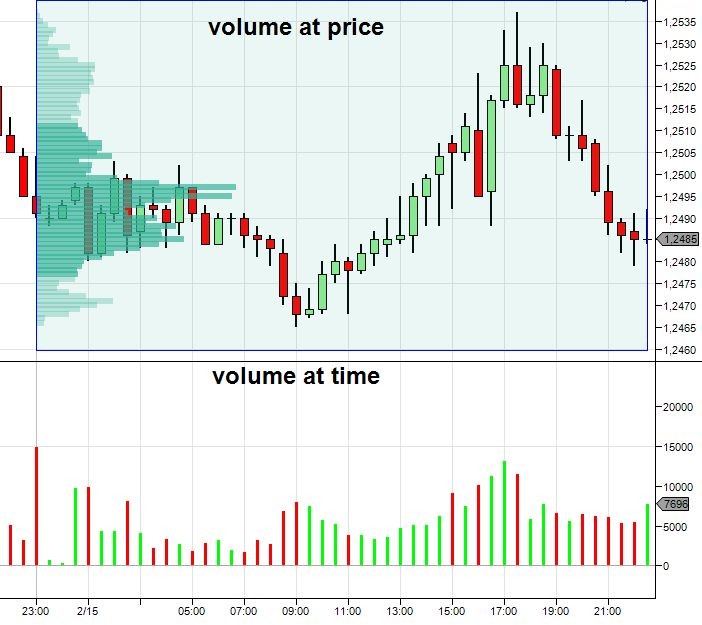
The Volume Profile system groups market transactions based on price points instead of using time as its organizing principle. The indicator shows market participation zones instead of price differences between consecutive candles during the chosen time span. The price levels show their activity levels through horizontal distribution which reveals where buyers and sellers actively engage with each other.
Let’s say EUR/USD trades between 1.0800 and 1.0900 over several days. Volume Profile may show that most activity clustered around 1.0850. The market value at this stage functions as a benchmark which buyers and sellers used to establish their initial price agreement. The market uses price changes to respond when prices exceed their normal trading area because traders restore their market funds to the market.
The entry of one standard lot at high-activity zones enables traders to set particular risk boundaries because each pip movement results in a ten US dollar value change.
What is market profile and its role in auction theory
Market Profile organizes price activity using time rather than volume. The indicator shows market duration at various price levels which helps traders find market balance points and areas where prices tend to reject quickly. The method uses auction theory principles which show prices will rise or fall to draw participants until buyers and sellers establish a short-term market stability.
The GBP/USD currency pair operates within the London trading session while it keeps moving between a small range of prices. The Market Profile shows this region as a tight group of data points which indicates that market participants have accepted the price level. The price zone shows minimal market activity when prices reach either above or below this area. The upcoming treatment sessions will follow these established reference points.
The planning process for 0.5 lots trading requires entry points near accepted value areas because this approach enables traders to set their stops with greater precision. Margin usage and leverage decisions become more structured because risk is defined relative to observed market behavior rather than arbitrary distances.
Key differences between volume profile and market profile
Volume Profile and Market Profile operate through distinct methods to analyze market structure yet they both reveal trading activity hotspots in the market. Volume Profile shows the amount of market activity which takes place at different price points but Market Profile tracks the duration of price stabilization at these levels. The way traders use these tools depends on their specific interpretation of each tool during actual market operations.
The exchange rate between USD/JPY shows a 100-pip trading band throughout each week. The Volume Profile indicates that most market participants active near the lowest point of that price range which indicates buyers were actively participating in the market. The Market Profile system shows that price spent most of its time at the midpoint which suggests a short period of market stability. The two observations present accurate information which shows distinct behaviors in human conduct.
The Volume Profile tool enables traders to identify entry points and stop-loss levels through its ability to show which price levels attract the most market activity when trading a single lot worth ten US dollars per pip. Market Profile enables traders to determine if price movements follow natural patterns or if they deviate from their natural value which affects their ability to use leverage and manage margins.
How volume profile is applied in forex trading
The Volume Profile analysis helps FX traders find market areas where traders execute most of their trades and shows them where market activity becomes less active. The three areas serve as planning reference points which help traders identify their market entry points and exit points and define their risk limits. Market activity levels which traders monitor help them locate the market segments where assets used to hold value.
Let’s say EUR/USD trades higher during the New York session after consolidating earlier in the day. The Volume Profile shows that market participants active in the current price area which corresponds to the previous trading range. The market becomes more liquid when prices return to that specific area because it provides traders with improved conditions to perform their trades. The system enables users to establish exact risk parameters through its 0.3-lot position which values each pip at approximately three US dollars.
How market profile is applied in forex trading
The Market Profile system helps FX traders study price movements which occur at particular levels throughout different time periods. The tool displays which price levels have the longest duration instead of showing transaction amounts to enable users in finding market equilibrium points and price fluctuations that differ from market value. The current framework allows researchers to perform better session-based analysis through its predefined structure.
Let’s say EUR/USD opens the London session and trades within a tight range for several hours. Market Profile shows this market behavior through a clear value area which it displays. The market shows rejection instead of acceptance through price movements which cross above the established range but remain inside that area for a brief time. The provided data enables us to develop trade scenarios which include particular performance targets.
Market Profile analysis between different trading sessions enables traders to build their preparation abilities. Users can develop their trading skills by studying historical market data on trading platforms which teaches them effective risk management techniques suitable for their investment amount.
Integrating volume profile and market profile with price action
Profiles become more effective when combined with price action rather than used in isolation. The price structure shows market direction and trading patterns through Volume Profile and Market Profile systems which identify active market areas and price reactions that occur within these zones. The two systems work together to create a system which enables better trade planning operations.
The EUR/USD currency pair showed a direct price increase until it reached the point where traders showed their highest level of interest. The Volume Profile system demonstrates that various market participants active at this price level while Market Profile indicates this price area maintained continuous market activity throughout an extended time period. The two elements establish a brief market equilibrium which does not prove that the market conditions will transform right away. The market will likely continue its upward trend when price moves above the zone while spending less time in the lower area.
The planning of a 0.5-lot trade which values one pip at approximately five US dollars becomes more accurate when traders enter the market at prices which match the established value areas. The reduction of stop distance becomes possible because risk assessment focuses on behaviors which people can observe which determines their margin usage and their exposure to leverage.
Conclusion
The Volume Profile and Market Profile systems enable users to study market behavior through organized methods which extend past the basic price chart evaluation. Users can understand decentralized FX market structure by using these tools which show how activity distribution and price acceptance times affect different market levels.
The system enables users to make exact changes to their margin and leverage settings which enable them to keep their trading exposure at levels that match their current account funds. The evaluation process of risk levels depends on risk profiles which determine appropriate stop locations but mathematical calculations enable risk assessment.
