Institutional order blocks and supply/demand zones explained
The price movement becomes rapid when price reaches specific areas on a chart because of two analytical tools known as institutional order blocks and supply and demand zones. The market creates these areas because major market participants need to execute large trades which exceed what the current market price can handle. The way orders distribute across time creates distinct price levels which exist between different market areas.
A bank needs to acquire EUR/USD at a position value which exceeds multiple thousand standard lots. Entering all orders at once would move price unfavorably. The execution process extends across different market levels which occur when market conditions have better liquidity. The market price rises rapidly when buying pressure exceeds the number of available sell orders until it reaches a point where demand becomes unfulfilled.
The market zones hold significance because prices tend to move back toward these areas when they reach them. The market shows buying strength when price returns to areas where investors used to buy heavily because demand will probably consume all available supply at that level.
How institutional participants operate in the forex market
The forex market contains institutional participants who include banks and hedge funds and asset managers who conduct trades with positions that exceed the typical size of retail investor transactions. The participants conduct their trades through standard lots which consist of million currency units which determines both execution processes and market price behavior. The base currency standard lot contains 100,000 units while institutional trading operations manage between hundreds and thousands of standard lots.
An institution needs to achieve trading exposure that matches 500 standard lots in the EUR/USD currency pair. The execution of this position at one price needs enough market liquidity because otherwise the trading process will produce higher transaction expenses. The company solves this problem by dividing orders into smaller parts which staff members finish by working through different price levels and session periods. The process shows how prices will stop moving before they stabilize before making a fast price change when market liquidity becomes available.
Margin and leverage are also managed conservatively at this level. The available leverage which institutions use enables them to achieve capital efficiency while maintaining their risk exposure at established limits instead of seeking to maximize investment risk.
Market microstructure and the origin of order imbalances
Forex market microstructure explains how prices change as buy and sell orders interact. The price will shift when all available liquidity at that specific market level becomes exhausted. The occurrence of one-sided order flow creates an unbalanced market which results in fast price changes instead of the typical slow price progression of pip-by-pip movements.
Let’s say EUR/USD is trading near 1.1000 and large buy orders enter the market. The trading system operates with 100,000 units as its standard lot size which produces particular monetary effects when traders move their prices by one pip according to their chosen position size. If buy orders exceed available sell orders at that level, price must move higher to find new sellers. The price movement creates a clear price difference which appears on the chart.
The amount of trading volume which can be used depends on margin and leverage but these factors do not affect the fundamental trading operations. The price system of the market continues to follow net order flow instead of trader intentions even when traders use high levels of leverage. When multiple large orders are executed across nearby prices, the result is an area where transactions occurred unevenly. The existing imbalances between different areas tend to match the regions which institutions will later determine as their areas of interest.
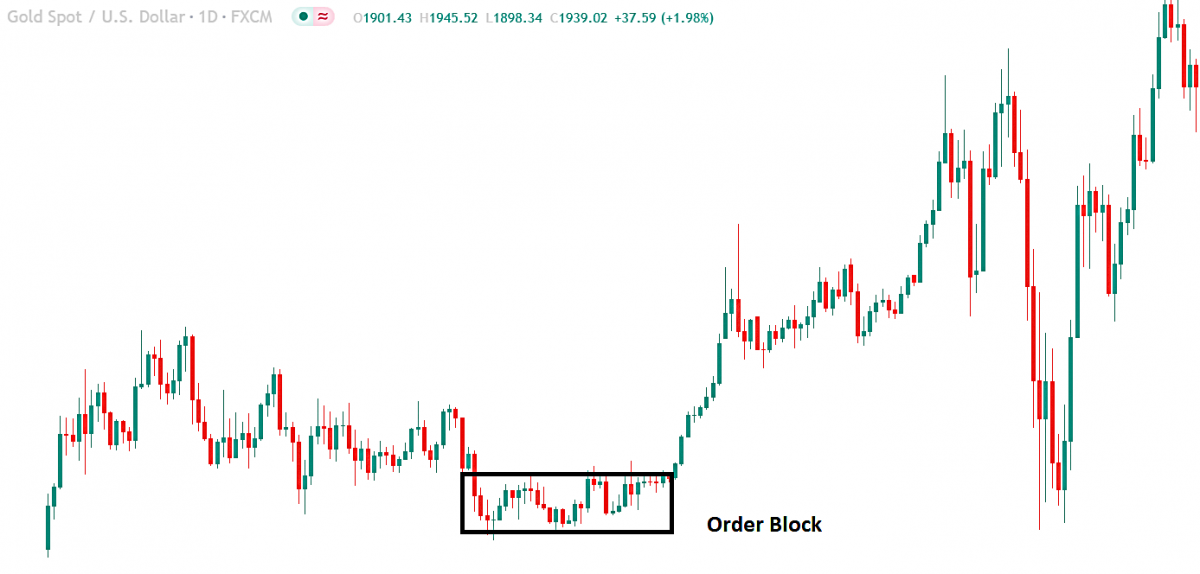
Defining institutional order blocks
The institutional order blocks display price zones which served as primary trading areas for major financial institutions until market trends started to override these areas. The market segments into different zones because institutions operate with large position sizes which exceed 100 to 1000 standard lots and need time to execute their trades at specific prices. The execution process creates multiple levels which generate separate marks that appear on the chart.
The price will experience a brief period of stability before it starts a 80 pip price increase during this short time period. The market experienced a fast market transformation because customers placed more purchase requests than vendors could meet. The last bearish or neutral candle which occurred before the market started rising indicates the order block because it shows the price area where investors conducted most of their purchases. The market area which shows outstanding orders that have not received execution through price returns.
The market will experience price deceleration and potential price reversal when EUR/USD returns to an order block and demand zone becomes active. The reaction does not happen with certainty because it demonstrates how big market orders affect available market liquidity. Order blocks provide traders with the ability to determine proper stop distance measurements which help them calculate their risk exposure in pips and determine suitable position sizes instead of using predetermined target values for their trades.
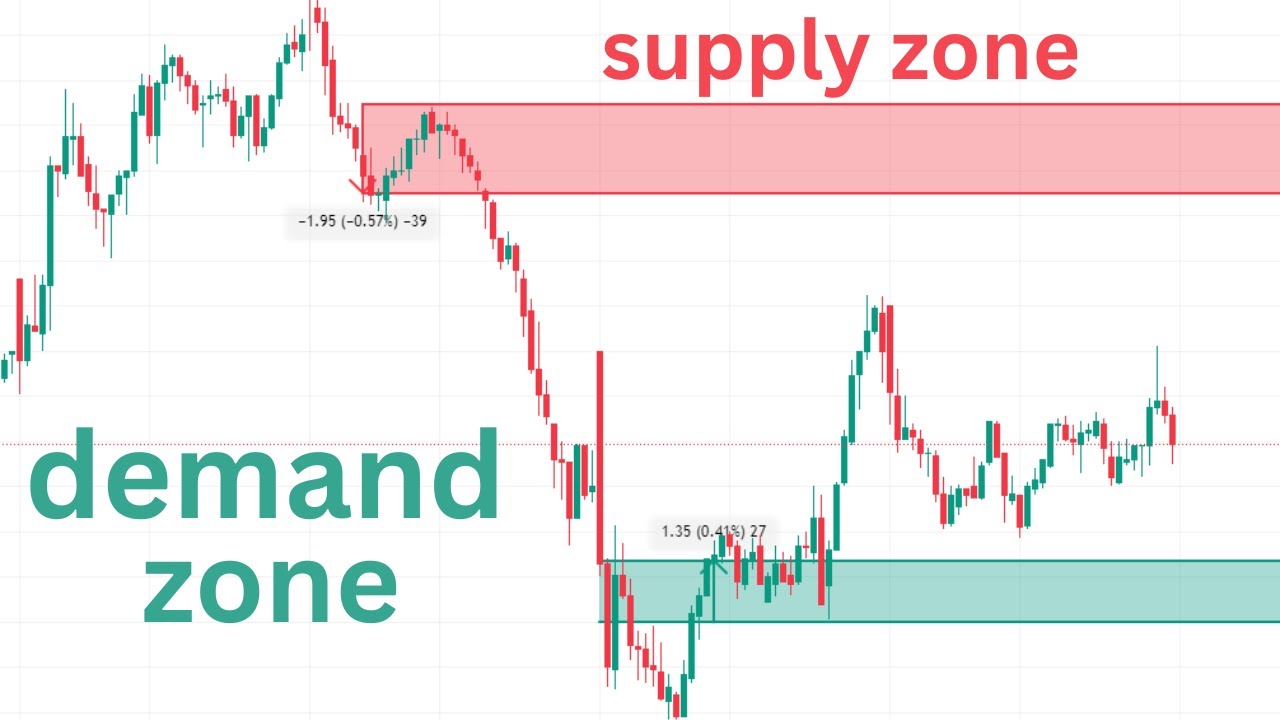
Understanding supply and demand zones in forex
The supply and demand zones show specific price levels which experience stronger buying and selling activities than the opposing market forces. The market segments into different zones because traders conduct their transactions through fixed volume amounts which we call lots and the market price shifts when investors run out of available trading capital. The market price will increase when demand surpasses available supply but it will decrease when supply exceeds market demand.
The EUR/USD exchange rate maintained a restricted price range until it experienced a 60 pip decline which occurred during a short period of time. That move suggests sell orders absorbed all available buy orders near that level. The market price range which existed before the market decline established itself as a supply zone. The market will experience new selling pressure when price reaches this specific area if market conditions remain identical to those of the previous event.
A trader who risks 20 pips with one standard lot position will experience a particular monetary loss because each pip represents a fixed amount of money. The adjustment of stops and position size should occur based on actual pip risk which stems from price movements at supply or demand zones.
The relationship between order blocks and supply and demand
The market behavior which institutional order blocks and supply and demand zones describe exists under two distinct analytical approaches. The two systems operate based on how big trading volumes in standard lots affect the current market liquidity levels. The difference lies in how the zones are identified and interpreted on a chart.
The market experienced a short period of stabilization before it started a strong price increase. The consolidation area shows the location where buy orders were combined. The area functions as a demand zone because market participants applied more buying force than selling force. The same market area functions as an order block because it marks the last bearish or neutral price zone which precedes the market's upward movement. The market price shifted because investors generated an unbalanced order flow.
The trading activity tends to rise when prices reach this specific price range. The requirement establishes particular boundaries which determine where stop orders should be placed and the highest level of market volatility traders can tolerate. A trader who risks 25 pips while knowing the pip value can determine their position size and margin requirements with better precision when the trading zone shows distinct structural elements.
Price behavior around institutional zones
The price behavior in institutional zones follows predictable patterns because market liquidity interacts with order flow. The trading activity in the market becomes more active when price reaches a previous order block or supply and demand zone because new market orders start interacting with resting orders. The two elements will either create a lasting bond or create a short access point which will allow additional movement.
The price returns to a demand zone following its 40 pip decline. The market will achieve price stability through a limited price range because selling pressure encounters the current batch of buy orders. The trader would use a 15-pip stop to calculate risk when they observe this market reaction. The standard lot system enables traders to determine exact position sizes and manage their trading margins through its specific monetary value per pip.
The reversal process fails to happen in all designated areas. The price movement shows no market response because there is not enough liquid assets available in the market. The final result remains unchanged because price fluctuations stem from the complete number of market deals instead of the funds which traders maintain in their accounts. The analysis of price movements across these zones enables traders to improve their market entry techniques while they achieve better risk management and stay away from placing stops in busy trading regions.
Conclusion
The analysis of price movement becomes possible through institutional order blocks and supply and demand zones because these elements help traders understand how order flow and liquidity affect market behavior. The concepts show how prices react in specific market conditions rather than studying separate market indicators. Their main value exists in enhancing trade structures instead of making future market predictions.
The correct method of pip value calculation through lot size adjustments helps traders control their market exposure when they use different leverage levels for their trades. Risk management takes precedence over entry timing according to this method. Zones define particular areas which show dangerous spots and protected areas which create dependable results.
The concepts work best when users use them as contextual tools which need correct position size management and market understanding.
