Keltner channel strategy
This article is centered around a very useful indicator based trading strategy that its signals have proven over time to be very effective and highly probable. The indicator is known as the Keltner channel: A volatility based indicator that envelopes both sides of the price movement on a price chart with a lower and an upper line, forming a channel-like structure around the price movement of the currency pair.
Traders use this indicator as a major part of their technical analysis to determine the direction of price trends and trade alongside the bias.
The Keltner channel indicator is named after its creator, a famous commodity trader known as Chester Keltner.
Chester Keltner introduced this technical indicator to the trading community in the 1960s. Initially, the indicator was designed to use simple moving averages and the high-low price range to derive the upper, lower and middle lines of the Keltner channel.
Later in the 1980s, the indicator was developed and improved upon by world-renowned trading Guru Linda Bradford Raschke.
She updated the Keltner channel indicator by replacing the simple moving average with an exponential moving average. She also introduced the average true range to derive the upper and lower line of the Keltner channel.
The Linda Bradford version of the Keltner channel indicator is accepted internationally and is still in use today.
The advantage of the newer version over the former is that the exponential moving average places more emphasis on the recent changes in price movements compared to the simple moving average. In effect, the exponential moving average reacts faster to changes in the direction of price movement. With this, the Keltner channel does provide an accurate overall direction of the trend by smoothing the price movement.
How is the linda bradford version of the keltner channel calculated.
The Keltner channel technical indicator is composed of three separate lines derived from the following calculations.
The middle line of the channel = the exponential moving average.
The upper line of the channel = [the exponential moving average] + [a multiplier value of the Average True Range (ATR * Multiplier)].
The lower line of the channel = [the exponential moving average] - [a multiplier value of the Average True Range (ATR * Multiplier)].
The period of the exponential moving average has a default input value of 20 and upper, lower lines of the Keltner channel have a standard Average True Range multiplier value of 2.
The channel usually expands and contracts as the volatility measured by the ATR increases and
decreases.
Adjusting the keltner channel indicator setting
The input value of the exponential moving average and the average true range multiplier of the Keltner channel indicator can be adjusted to fit the volatility of any currency pair price movement, any timeframe and also any trading style.
For example, the most effective Keltner channel indicator setting for day trading should have an exponential moving average input value between the range of 20 to 50 and an Average True Range multiplier between the range of 1.5 to 2.5.
Image of Keltner Channel Indicator Setting
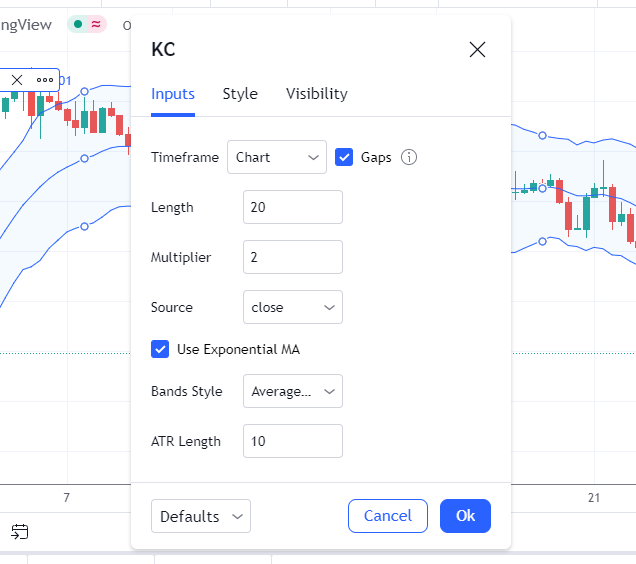
It is helpful to know that the higher the multiplier the wider the channel is going to be plotted over price movement. Conversely, the smaller the multiplier, the more densely packed the channel is likely to appear.
How do you know your adjustment is effective
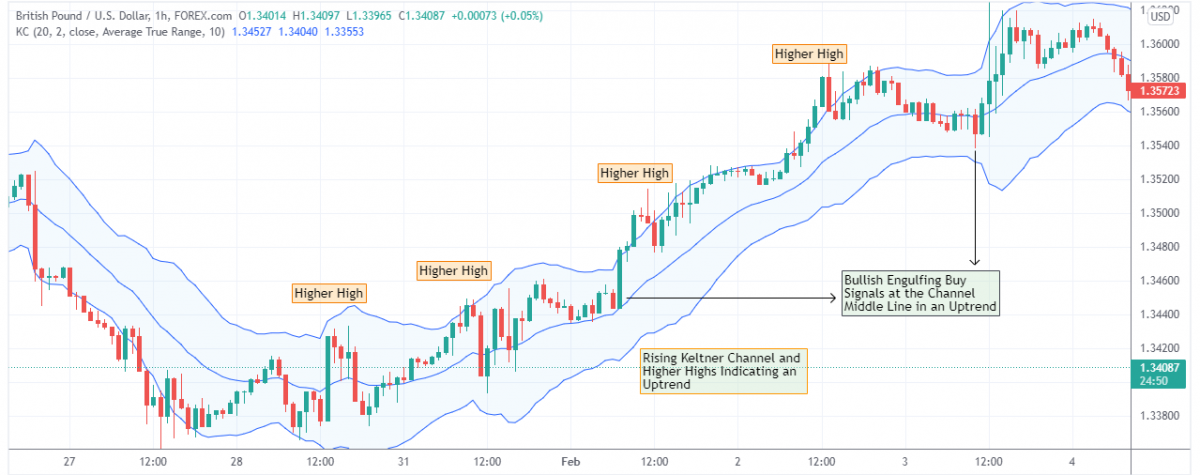
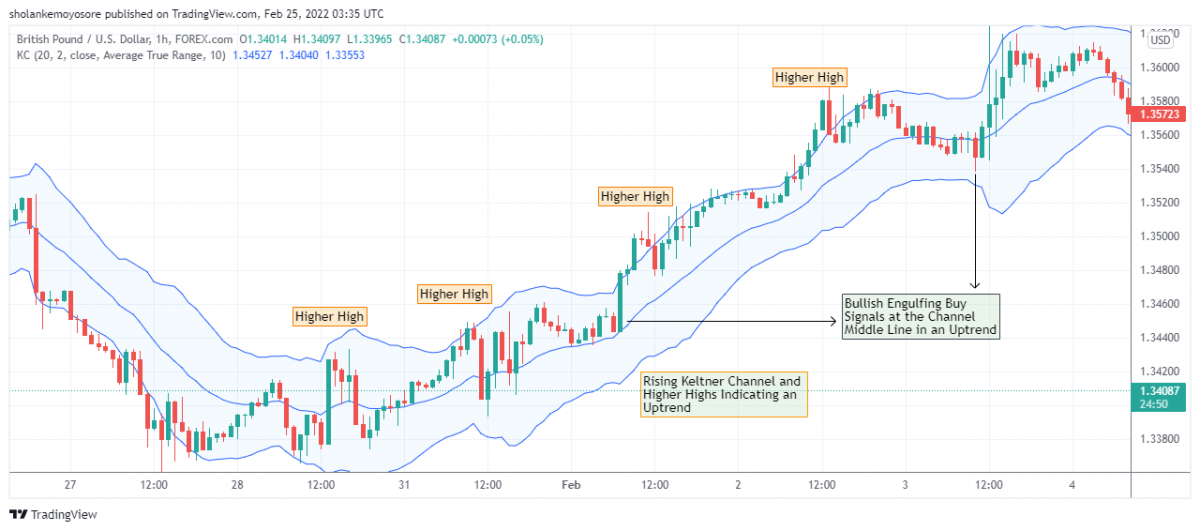
When the price movement of a currency pair is in an uptrend, the price movement must stay above the lower line of the band/channel. This is because the price movement will make higher highs around and above the middle line of the band.
Eventually, the bullish momentum will cause the price movement to rally toward the upper line of the band and sometimes beyond it.
Image of Uptrend in a rising keltner channel
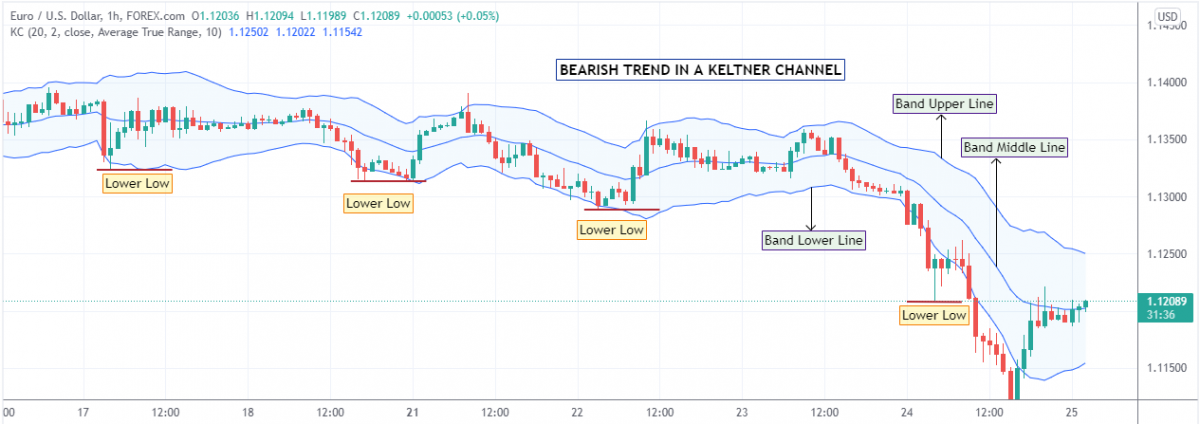
When the price movement of a currency pair is in a downtrend, the price movement must stay below the upper line of the band/channel. The reason for this is that the price will make lower lows around and below the middle line.
Eventually, the bearish momentum will cause the price movement to decline toward the lower line of the band and sometimes beyond it.
Image of Uptrend in a rising keltner channel
Keltner channel trading strategies
1. Trend pullback trading strategy with candlestick entry signals
This trading strategy is dependent on the direction of the current trend. Trend trading is undoubtedly the most reliable form of trading because momentum in terms of trading volume and volatility of a certain currency pair or asset tends to remain in a particular direction for a long time.
Of course, when a trend is identified (either bullish or bearish) we have to wait for specific high probability criteria of price movement to occur before we decide to execute a buy or sell market order with a candlestick entry signal. This strategy incorporates candlestick patterns as entry signals because they provide valuable information about an asset's price movements. This enables traders to interpret price information quickly from just a few price bars.
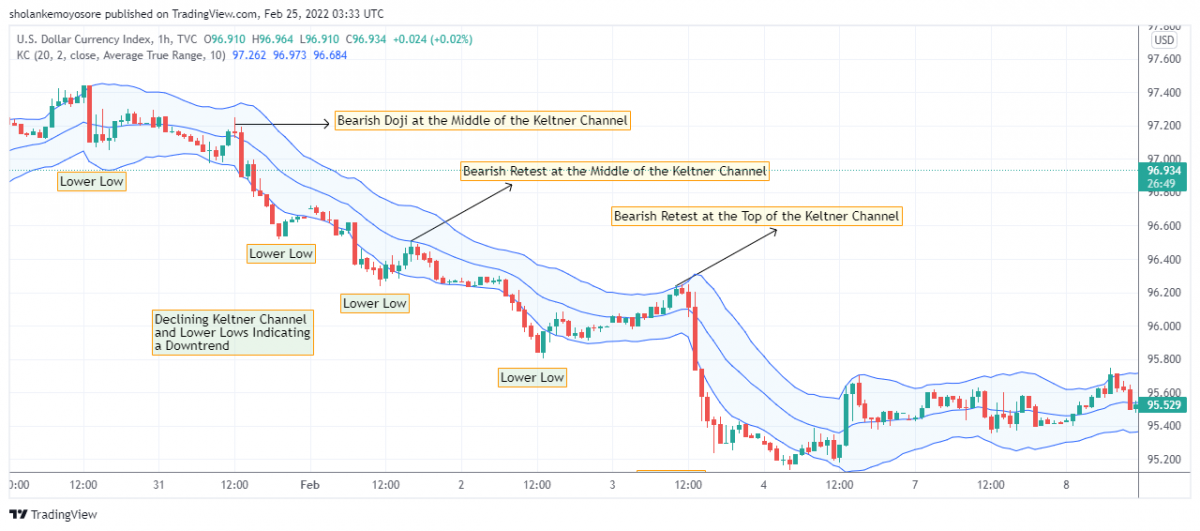
The high probability criteria and requirements to trade alongside a bearish trend with the aid of the keltner channel is as follows.
- Firstly you must identify a downtrend by the decline in the slope of the Keltner channel.
- When a downtrend price movement is confirmed, the next step is to anticipate pullbacks or retracements of the bearish price movement.
- The pullback or retracement are expected to get to the middle line or slightly above the middle line of the channel before considerations to execute a sell market order.
- At the middle line or slightly above the middle line. Execute a sell market order at the formation of a bearish candlestick entry pattern.
The most powerful candlestick entry patterns include bearish Doji, bearish engulfing, bearish pin bar, bearish hammer and a bearish orderblock.
- Place a stop loss right above the bearish candlestick entry pattern.
Image of sell setups in a bearish trend
The high probability criteria and requirements to trade alongside a bullish trend with the aid of the keltner channel are as follows.
- Firstly you must identify an uptrend by a rise in the slope of the Keltner channel.
- When an uptrend price movement is confirmed, the next step is to anticipate pullbacks and retracements of the bullish price movement.
- The pullbacks or retracements are expected to get to or slightly below the middle line of the channel before considerations to execute a long market order.
- At the middle line or slightly below the middle line. Execute a long market order at the formation of a bullish candlestick entry pattern.
The most powerful candlestick entry patterns include bullish Doji, bullish engulfing, bullish pin bar, bullish hammer and a bullish orderblock.
- Place a stop loss right below the bearish candlestick entry pattern.
Image of buy setups in a bullish trend
2. Breakout trading strategy
This strategy is based on the general concept of the market volatility cycle. The Keltner channel is well known for its breakout prediction of future price movement from a consolidating or sideway market.
In spite of the fact that it is a lagging indicator, its breakout signals are more accurate because it derives its reading from price movement and price volatility.
The Keltner channel tends to contract and move in a straight direction whenever price is moving sideways or consolidating.
Based on the concept of market volatility cycles, a sideway consolidation usually precedes an explosive price expansion.
To capture the upward price expansion from a consolidation, open a long market order at the break of the upperline of the channel and conversely to capture the downward price expansion from a consolidation, open a short market order at the break of the lowerline of the keltner channel.
Conclusion
There are several other popular indicators just like the Keltner channel that fit the definition of enveloped based indicators. Among the popular examples of this type of indicator is the Bollinger Band indicator.
These envelope-based indicators have similar practical trading applications, but the channel interpretations of currency or forex pair price movement usually vary depending on the particular indicator formula.
When trading different assets, you may need to tweak your Keltner Channel settings slightly because a setting that works for one asset might not work for another.
Before using Keltner Channels strategies to trade with real money, it is very helpful to practice using the Keltner channel indicator with other indicators and candlestick entry patterns in a demo account. Practice deciding which trades to take and which to avoid. Also, find out the most suitable time for the highest probable and profitable trade setups, make adjustments to the indicator, and determine the most effective confluence signals from other indicators.
You should only trade with real capital once you have consistently achieved success over a period of 2 months.
A final note is, the popular Forex charting software MetaTrader 4 platform does not include a built-in indicator for plotting the Keltner channels. Alternatively, you can opt to download a third-party developed Keltner channel indicator on the MetaTrader platform or find the indicator on your broker's platform which is also a preferred trading platform among majority traders today.
Click on the button below to Download our "Keltner channel strategy " Guide in PDF
