Orderblock trading strategy
As a trader who has been in the forex trading industry for a while, the dogma of supply and demand is certainly not a new concept. Of course, there are certain aspects to the price movement in the financial markets that is governed by supply and demand factors but they cannot arrive at the fundamentals of what the institutions are doing in terms of buying and selling.
Apart from the commonly used supply and demand zones, orderblocks are very specific levels of price movement that can be refined to precise price levels (not as a broad range or zone) on lower timeframes.
Central banks and large institutions are the key players of foreign exchange transactions of the financial markets; they set the tone of price movement and the directional bias on the higher timeframe charts by accumulating large volumes of orders (bullish or bearish) at a particular price level, these volumes of orders are then released in smaller packets by orderblocks in the same direction on the higher, intermediate and lower timeframe charts.
The term ‘orderblocks’ refers to certain candlestick formations or bars that suggest what is known as 'smart money buying and selling' when viewed in an institutional context (i.e the foreign exchange transactions between central banks, commercial hedgers and institutional traders) displayed on price charts. The term smart money will be most often used in this article to narrate a clear and concise approach to the orderblock theory and how to trade with the orderblock strategy effectively.
This can be the very beginning of your understanding (from an institutional perspective) of how various levels of price movement are determined by these large scale entities (banks and institutions). You will also clearly understand why the market moves the way it does, the mechanics behind the highs and the lows that form in price movement, when an impulsive price swing is expected to retrace, where to expect the next expansion of price movement and the extent of the expansion.
Formation of an Orderblock
Orderblocks usually form at the extremes and the origin of price movement. They might appear in varying forms but their identification is distinct by a specific price pattern.
A bullish orderblock is identified by the most recent down-close (bearish) candle followed by an up-close (bullish) candle that extends above the high of the most recent down close (bearish) candle.
Varying examples of Bullish orderblocks
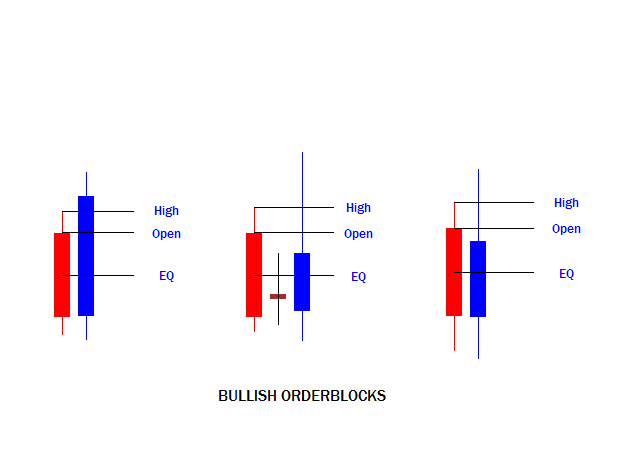
This can appear on both bullish and bearish price moves but is more highly probable on a bullish price move and a bullish directional bias.
Conversely, a bearish orderblock is identified by the most recent up close (bullish) candle followed by a down-close (bearish) candle that extends below the low of the most recent up-close (bullish) candle.
Varying examples of Bearish orderblocks
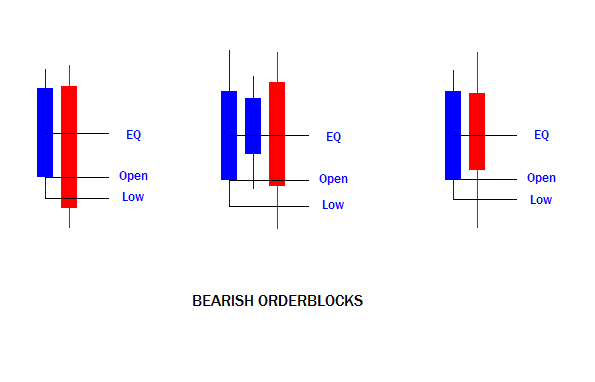
This can appear on both bullish and bearish price moves but is more highly probable on a bearish price move and bearish directional bias.
This price pattern is often confused among retail traders, as supply and demand zones or sometimes seen as bullish engulfing or bearish engulfing patterns but the mechanics and the theory behind the formation of the orderblocks and their impact in price movement serves greater insights to trading the orderblock trading strategy profitably.
A brief review on the mechanics of orderblocks
Most often, the candlestick formation of orderblocks, when viewed on lower timeframes, is seen as an extended period of consolidation which simply means that orders have been built up by large banks and institutions before the spring of the large extrapolated price move from the orderblock (lower timeframe consolidation).
For instance, a daily bullish orderblock when viewed on an hourly chart, it is seen as a consolidation (build-up phase) before the bullish impulsive rally in price move.
Image illustration of a high probable bullish orderblock

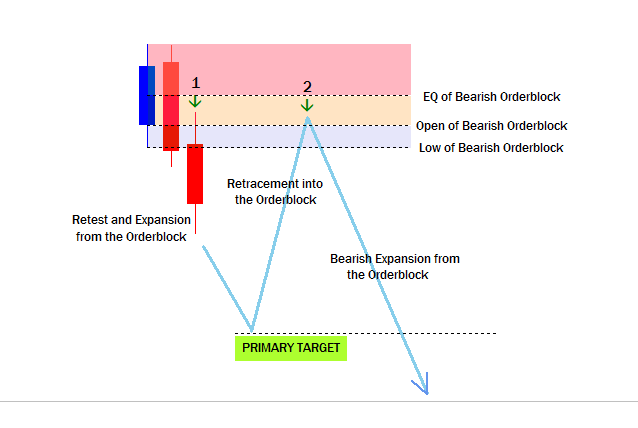
Image illustration of a high probable bearish orderblock
Now that we can clearly identify bullish and bearish orderblocks. There are certain factors that will be discussed in the next section and these conditions must be met before an orderblock is deemed as highly probable.
When an orderblock meet the criteria of high probability in price movement, a large extrapolated price move is propagated by a retest with either of the next series of candlesticks or bars toward the direction of orderblock. Price movement is characterized by impulsive price expansions and retracements hence after an impulsive price expansion from the orderblock, there is usually a retracement into the high probable orderblock for the second leg of an impulsive price expansion.
Criteria to framing high probable orderblocks
- Long term trends: First and foremost, emphasis is laid on long term trends. The popular saying that the trend is your trend also applies to the orderblock trading strategy. Because large banks and institutions place most of their orders on higher timeframes charts, therefore momentum and trends on the higher timeframe monthly, weekly, daily and 4hr are critical to selecting high probable orderblocks to hunt trade setups. Any timeframe below the monthly, weekly, daily and 4hr means leaving the higher timeframe premise to an intraday basis.
- Current price expansion: Understanding the current price expansion is equally important to detect the actions of smart money buying and selling. Focus should be on what these higher timeframe price moves are most likely reaching for. Therefore trading within this higher timeframe premise will remove a lot of the uncertainties that plague most traders in their hunt for trade setups when using the orderblock trading strategy.
- Market structure: The ability to identify lower timeframe market structure of price movement within a larger trend or a higher timeframe is key to identifying high probable orderblocks on intermediate and lower timeframe charts.
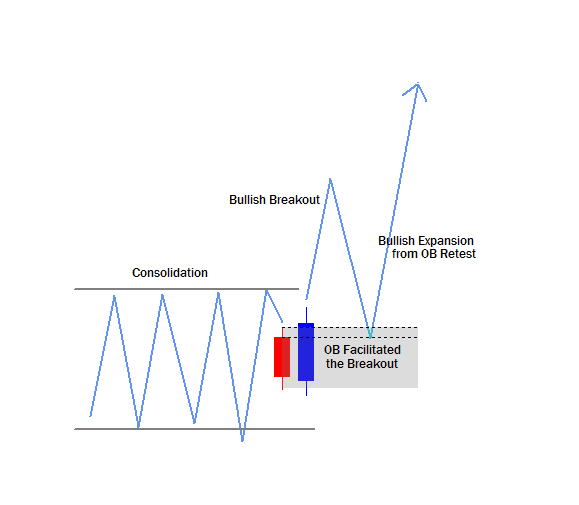
If the price is in a consolidation, we can frame high probable orderblocks after price has expanded out of the range. A retracement to ‘the orderblock’ that facilitated the breakout of the consolidation is deemed highly probable.
Image illustration of a High probable orderblock that facilitated the expansion from a consolidation price movement
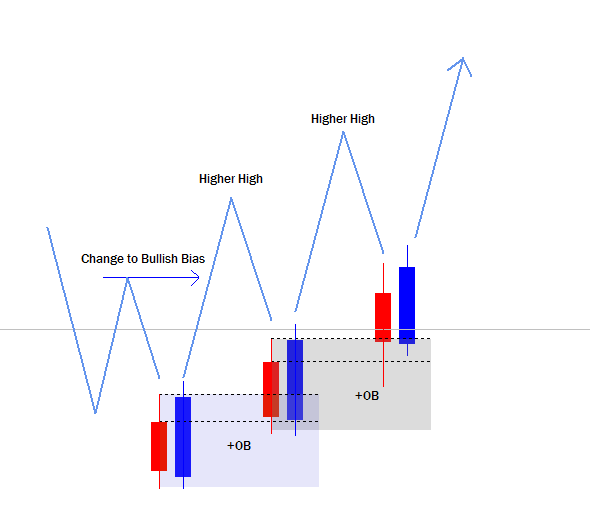
If price is making successive higher highs, only bullish orderblocks will be identified as high probable orderblocks.
Image illustration of high probable bullish orderblocks in a bullish trend of successive higher highs
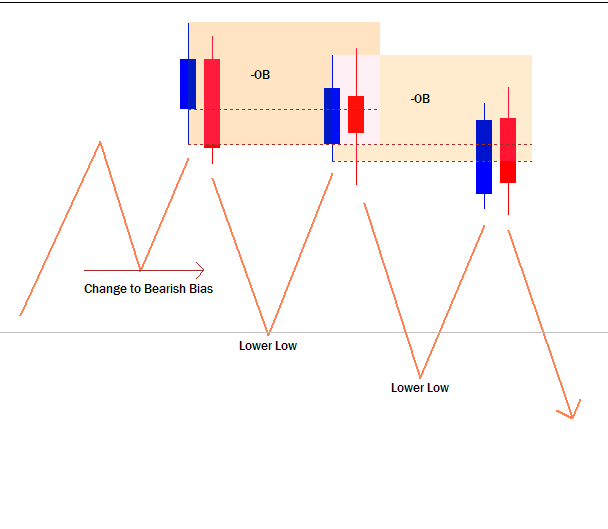
If price is making successive lower lows, only bearish orderblocks will be identified as high probable orderblocks.
Image illustrations of high probable bearish orderblock in a bearish trend of successive lower lows
- Moving averages: A pair of moving averages can be plotted over price movement to help keep our focus on a one-directional premise of the market. The pair of moving averages that can be used is either 18 & 40 EMA or 9 & 18 EMA. Crossovers are not necessarily needed but proper stacking or the opening up of these moving averages in the same direction is indicative of a buy or sell program. In a buy program, only bullish orderblocks are deemed highly probable and in a sell program, only bearish orderblocks are deemed highly probable.
- Fibonacci retracement and extension levels: In a buy program, the Fibonacci tool can be used to frame high probable bullish orderblock at a discount price which is usually at or below the 61.8% optimal trade entry level of a defined bullish price move and conversely in a sell program, the Fibonacci tool can be used to frame high probable bearish orderblock at a premium price which is usually at or below the 61.8% optimal trade entry-level above of a defined bearish price move.
The Fibonacci tool is not a magic indicator here but it is used to frame high probable discount orderblock in a buy program and high probable premium orderblocks in a sell program. The idea behind the effectiveness of the Fibonacci is that smart money accumulates long orders at cheap discount prices which is below the 50% of a defined bullish price move and also accumulate sell orders at a higher premium price above the 50% of a defined bearish price move.
- Most sensitive price levels of an orderblock: when hunting for a bullish trade setup, the most sensitive price level of the bullish orderblock to expect sharp price reactions or open a long market order is the high, the open and the midpoint (last most sensitive price level)
of the body of the last down candle of the bullish orderblock.
When hunting for a bearish trade setup, the most sensitive price level of the bearish orderblock to expect sharp price reactions or open a short market order is the low, the open and the midpoint (last most sensitive price level) of the body of the last up candle of the bearish orderblock.
Either of these three sensitive levels can be used as trade entry depending on the traders risk appetite and level of proficiency
Trade examples of high probable orderblocks
Example 1: Dollar Index on the daily chart
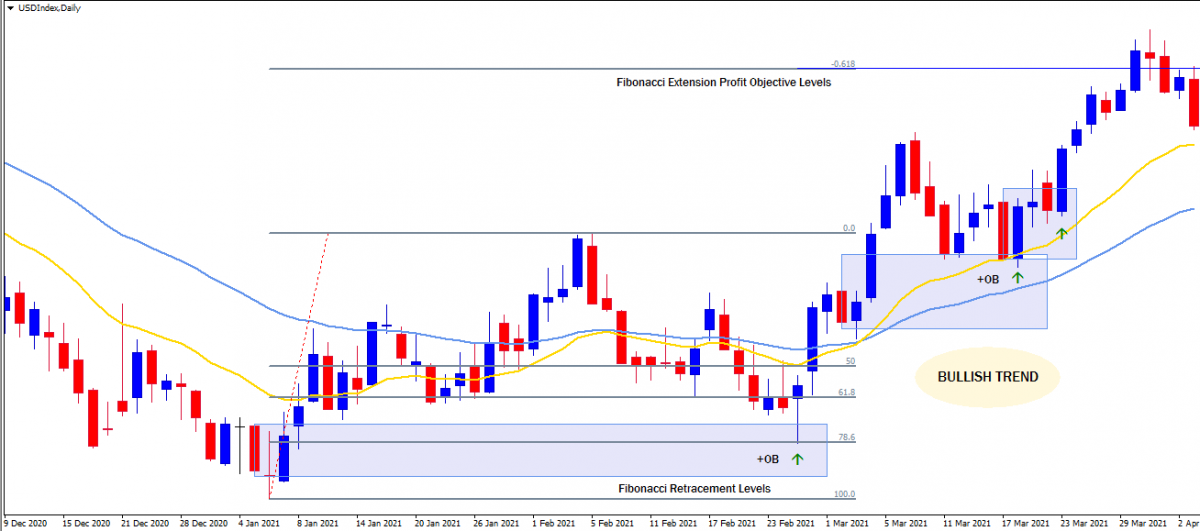
We can see framed high probability bearish orderblocks in confluence with the bearish trend, fibonacci retracement and extension levels, the 18 & 40 pair EMA.
Example 2: UsdCad on the daily chart
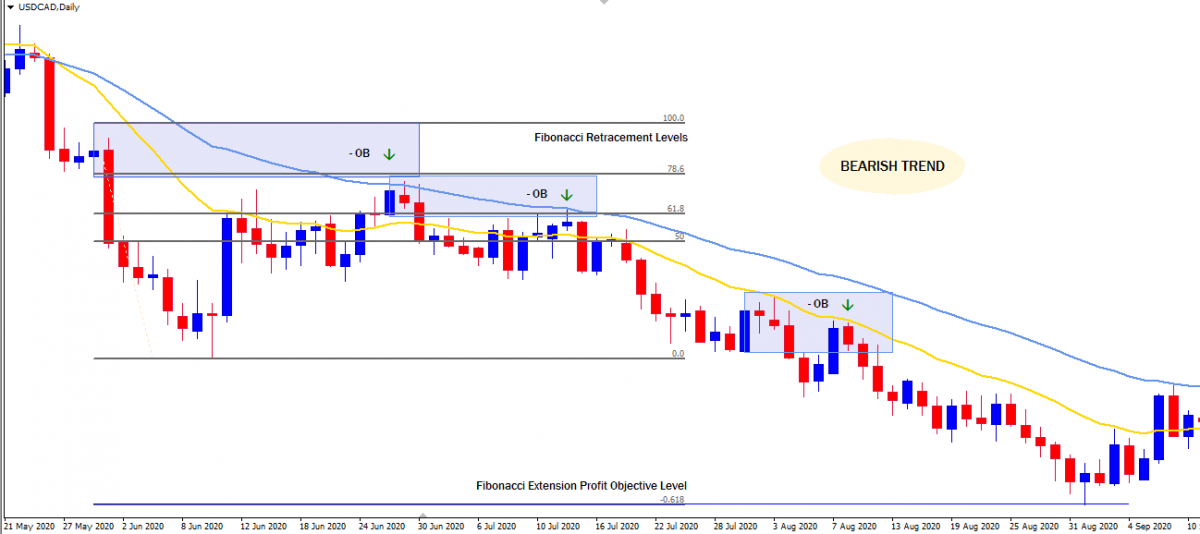
We can see framed high probability bearish orderblocks in confluence with the bearish trend, fibonacci retracement and extension levels, the 18 & 40 pair EMA.
Example 3: GbpCad on the 1hr chart
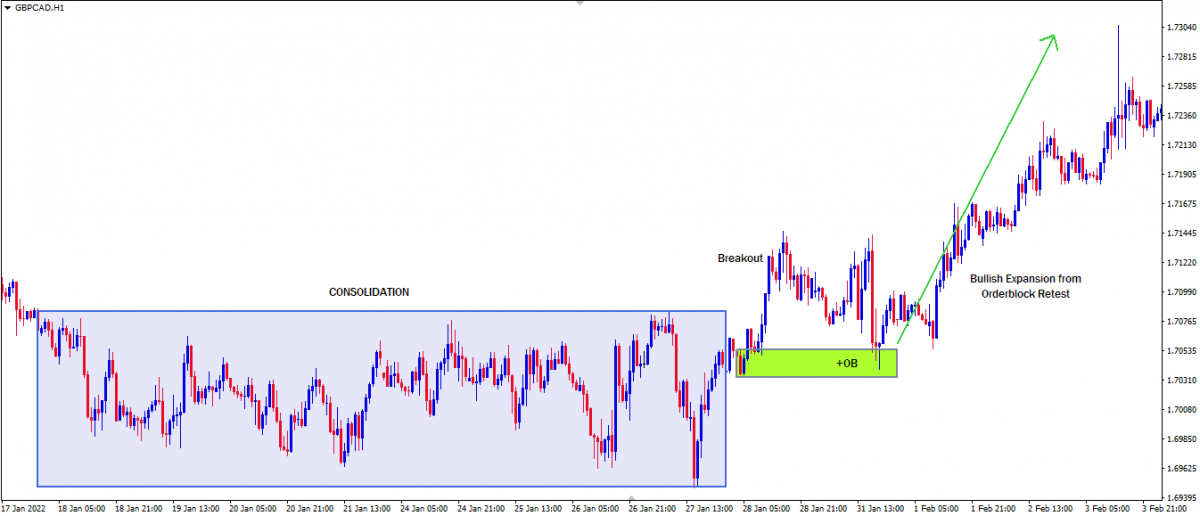
Notice the bullish orderblock that facilitated the breakout from the consolidation with a defined bullish price move. And then a bullish expansion from the retest of the orderblock.
There are lot of perfect trade examples of the orderblock trading strategy that can be reviewed in hindsight and the same strategy can also be used to nurture profit consistency in trading.
Click on the button below to Download our "Orderblock trading strategy" Guide in PDF
