Parabolic stop and reverse indicator
Forex trading, with its volatile nature and the vast array of influencing factors, demands a well-informed and strategic approach. This is where technical indicators step into the limelight. These analytical tools, based on mathematical calculations, historical price data, and market trends, serve as invaluable guides for traders.
Technical indicators, like the Parabolic SAR, provide traders with objective data points that can assist in making informed decisions. They help in identifying potential entry and exit points, gauging trend strength, and managing risk effectively. In a market where split-second decisions can make or break a trade, having a robust understanding of technical indicators becomes not just beneficial but necessary.
Understanding the basics
The Parabolic Stop and Reverse Indicator, commonly known as the Parabolic SAR or PSAR, is a dynamic technical analysis tool designed to assist forex traders in identifying potential trend reversals and determining optimal entry and exit points within an existing trend. Developed by the renowned trader and analyst J. Welles Wilder Jr., this indicator has earned its place as a valuable component in the arsenal of traders worldwide.
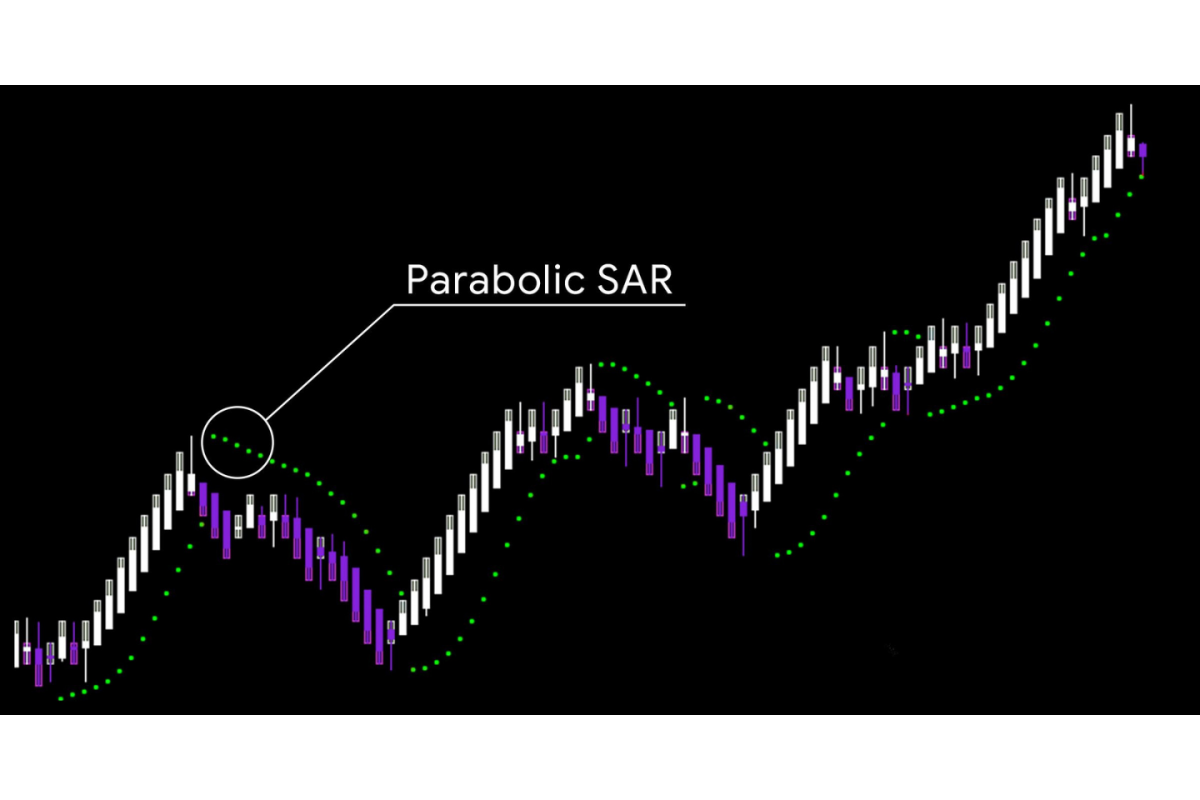
At its core, the Parabolic SAR relies on a mathematical formula to plot dots on a price chart. These dots, which appear above or below the price bars, serve as reference points that help traders gauge the direction of a prevailing trend. When the dots are below the price, it signals an uptrend, and when above, it indicates a downtrend. The primary purpose of the Parabolic SAR is to provide traders with a visual representation of potential reversal points, thereby aiding them in making informed decisions about when to enter or exit positions.
The history of the Parabolic SAR can be traced back to its inception in the 1970s by J. Welles Wilder Jr., a prominent figure in technical analysis. Wilder, known for his contributions to various technical indicators, developed the PSAR as a response to the challenges traders faced in identifying trend reversals. His aim was to create a tool that could adapt to changing market conditions and provide clear signals for traders.
How the parabolic stop and reverse indicator works
The Parabolic Stop and Reverse (SAR) Indicator employs a straightforward yet powerful formula for its calculation. Understanding this formula is key to comprehending how the indicator works. Here's a step-by-step breakdown:
The process begins with the selection of an initial SAR value, which is typically the lowest low of the first few data points. This initial value serves as the starting point for subsequent calculations.
The indicator identifies the highest high (for uptrends) or lowest low (for downtrends) in the data series over a defined period. This extreme point becomes a reference for the SAR calculation.
The AF is a crucial component that determines how quickly the SAR moves in response to price changes. It starts with a small value and can increase with each subsequent calculation, allowing the SAR to catch up with price movements.
Using the initial SAR value, the extreme point, and the AF, the SAR value for the current period is calculated. The formula for SAR calculation in an uptrend is:
SAR = Prior SAR + Prior AF × (Prior EP - Prior SAR)
And in a downtrend:
SAR = Prior SAR - Prior AF × (Prior SAR - Prior EP)
The calculated SAR value is plotted on the price chart as a dot. This dot represents the potential stop and reverse point for the trend.
Interpretation
Interpreting the Parabolic SAR's signals is crucial for effective trading decisions:
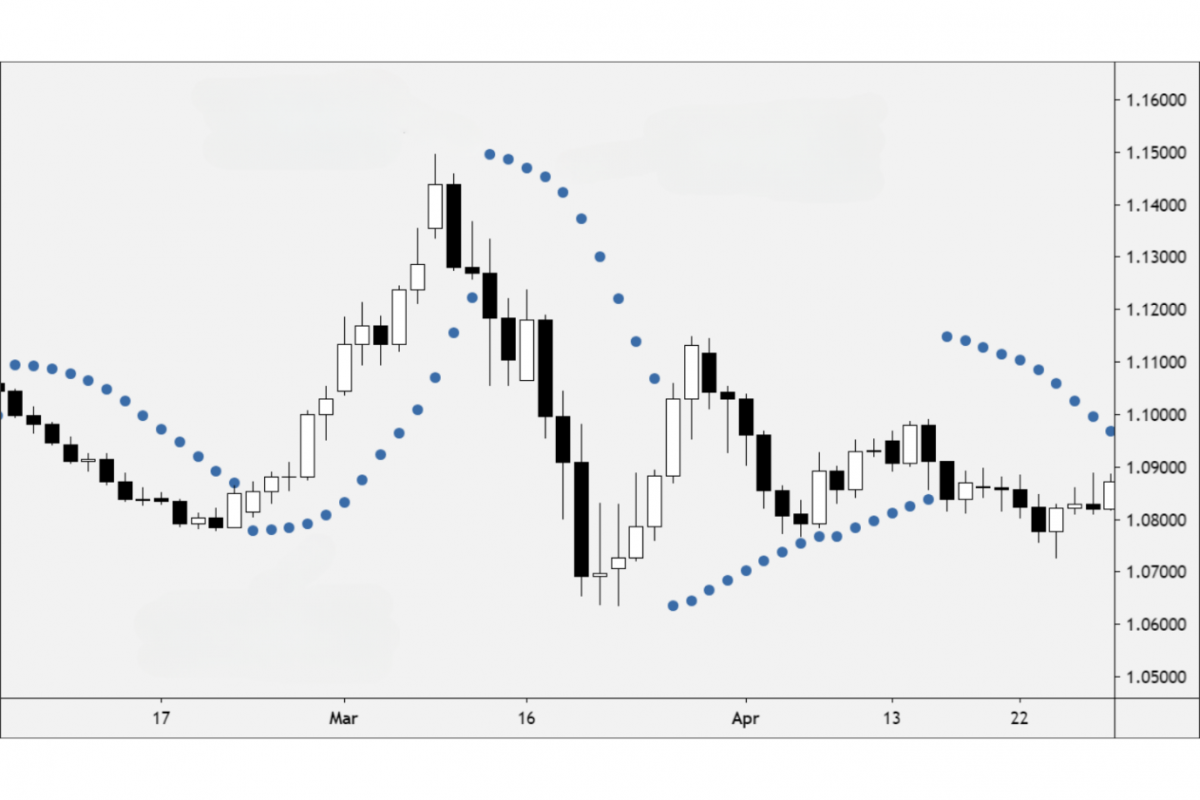
Uptrend: When the SAR dots are below the price bars, it suggests an uptrend. Traders may consider this as a signal to buy or hold long positions.
Downtrend: Conversely, when the SAR dots are above the price bars, it indicates a downtrend, signaling a potential opportunity to sell or maintain short positions.
Signal reversal: A reversal occurs when the SAR dots switch positions from above to below (or vice versa) relative to the price bars. This reversal signal is significant and often used to exit existing positions and potentially enter in the opposite direction.
Practical application
The Parabolic Stop and Reverse (SAR) Indicator's practical application lies in its ability to provide traders with clear entry and exit signals, helping them navigate the complexities of the forex market.
For entry signals, traders often consider initiating positions when the SAR dots align with the price trend. In an uptrend, this means looking for buy opportunities when the dots are below the price bars, indicating a bullish sentiment. Conversely, in a downtrend, sell signals emerge when the dots are above the price bars, signalling a bearish sentiment.
Real-life trading scenarios exemplify the Parabolic SAR's utility. For instance, if the SAR dots have been consistently below the price bars in an uptrend and then switch to above them, it can be a powerful signal to exit long positions and potentially enter short positions, anticipating a trend reversal.
When a trader enters a position based on SAR signals, they can set a stop-loss order just below the SAR dot in an uptrend (or above it in a downtrend). This strategic placement aligns with the indicator's purpose of identifying potential reversal points. If the trade goes against the trader, the stop-loss order helps protect capital by closing the position before significant losses accrue.
Advantages
Incorporating the Parabolic Stop and Reverse (SAR) Indicator into your forex trading strategy offers several distinct advantages:
Clear trend identification: The SAR's visual representation of trend direction simplifies the process of identifying trends, helping traders make well-informed decisions.
Dynamic adaptation: The SAR adjusts to market conditions, allowing it to stay responsive to price fluctuations and potential trend reversals.
Entry and exit signals: The indicator provides precise entry and exit signals, aiding traders in optimizing their trade timing.
Risk management: By strategically placing stop-loss orders based on SAR signals, traders can manage risk effectively, preserving capital.
Simplicity: The straightforward nature of the SAR makes it accessible to traders of all experience levels.
Limitations and considerations
While the Parabolic SAR is a valuable tool, it's essential to acknowledge its limitations and exercise caution:
Whipsaws: In choppy or sideways markets, the SAR can generate frequent and false signals, resulting in losses if traders act on them without discernment.
Lagging indicator: Like many trend-following indicators, the SAR may not provide timely signals at the exact moment a trend reversal occurs.
Dependence on timeframe: The choice of timeframe can significantly impact the effectiveness of the SAR. Traders should adjust settings to match their trading style.
Not a standalone solution: While useful, the SAR should be used in conjunction with other technical and fundamental analysis tools to make well-rounded trading decisions.
Market selection: The SAR may perform differently in various market conditions, so traders should consider its applicability in the specific currency pairs they trade.
Case study 1: Riding the trend
In this example, consider a trader focusing on the EUR/USD currency pair. The trader identifies a strong uptrend by observing that the SAR dots consistently appear below the price bars. Recognizing this as a bullish signal, the trader enters a long position.
As the trend continues, the SAR dots faithfully trail below the price bars, providing clear guidance. The trader sets a stop-loss order just below the most recent SAR dot to manage risk. Over time, the SAR dots remain below the price bars, reinforcing the upward momentum.
Eventually, when the SAR dots switch positions, moving above the price bars, the trader receives a signal to exit the long position. This strategic exit results in a profitable trade, with the trader capturing a substantial portion of the upward movement.
Case study 2: Trend reversal opportunity
In this scenario, let's examine the GBP/JPY currency pair. The trader spots a downtrend forming as the SAR dots consistently appear above the price bars. Recognizing this as a bearish signal, the trader enters a short position.
As the trend continues, the SAR dots maintain their position above the price bars. The trader sets a stop-loss order just above the most recent SAR dot to manage risk. After a period, the SAR dots switch positions, moving below the price bars. This signals a potential trend reversal.
The trader exits the short position and considers entering a long position, anticipating a bullish reversal. This strategic decision yields a profitable trade, as the currency pair indeed begins an upward trajectory.
Conclusion
In conclusion, the Parabolic SAR, developed by J. Welles Wilder Jr., operates on a straightforward formula, generating dots above or below price bars to indicate trend direction. It is a versatile tool suitable for traders of all levels.
Advantages of the SAR include its role in trend identification, provision of precise entry and exit signals, dynamic adaptation to market conditions, and effective risk management.
However, it's essential to approach the SAR with a keen awareness of its limitations. False signals in choppy markets and its lagging nature during trend reversals are factors to consider.
In practice, traders can utilize the SAR effectively by setting stop-loss orders based on its signals and incorporating it into a broader trading strategy.
The key to success with the Parabolic SAR lies in a thorough understanding of its mechanics, interpretation, and judicious application. Traders who grasp its nuances and exercise discipline in its use can harness its potential to make informed and profitable trading decisions.
