RECOGNIZING PATTERNS - Lesson 1
In this lesson you will learn:
- What are the Trading Patterns
- How to recognize the Emerging Patterns
- How Patterns help us in trading
There are a variety of readily identifiable historical patterns, which traders are generally united in their opinion of, as being the most robust and reliable, in terms of helping predict the most likely direction of price. For example: the head and shoulders pattern, double tops and double bottoms, the cup and handle, triangles, wedges, flags and pennants.
Head and Shoulders Top
This pattern is perhaps the most recognized pattern in all forms of trading, whether we're trading: equities, forex, indices, or commodities. It's generally used to identify a situation where a change in trend is developing, as a consequence of the current trend simply reaching an expiration of the trade's energy. The security traded follows an easily identifiable head and shoulders pattern whereby price fails in its attempts to find a new high, whilst falling back to a previous point, where support is lost and the security falls to find a new level.
The classic text book "head and shoulders" formation consists of: left shoulder, head, right shoulder and neckline. The left shoulder forms at the end of a market move, during which volume is higher.
After the peak of the left shoulder is formed, price falls back (partly due to low volume supporting price at its previous level). Price then rallies to form the head, due to normal or increased volume. The following fall and sell off is generally accompanied with lesser volume, as buyers are simply not there in any numbers to support the price.
The right shoulder is formed as price once again rises, but critically remains below the main peak referred to as the head. Price falls to a level close to the first valley, between the left shoulder and the head, or as a minimum below the peak of the left shoulder.
Volume is noticeably reduced as the right shoulder is forming, compared to the left shoulder and the head formation. Now a neckline can be drawn across the bottom of the left shoulder, the head and the right shoulder.
When price finally breaks downwards through this neckline and if it keeps falling after forming the right shoulder, it can be considered as final confirmation of the Head and Shoulders Top formation. It is quite possible that price pulls back to hit the neckline, before then continuing its declining trend.
A bottom head and shoulders pattern and formation is simply a reversal of the top head and shoulders. As opposed to being a trend reversion, from bullish to bearish, it's a reversion from bearish to bullish.
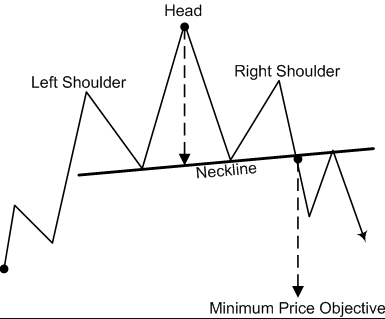
The neckline of the pattern (which we can easily draw) represents a support level, the accepted trading technique is to wait for the neckline to be finally broken before establishing that the new trend is beginning to develop.
As with many text book patterns there is nothing certain in these developing patterns, similarly a sudden change in sentiment, perhaps as a result of an economic calendar event proving to be a sentiment outlier, can suddenly demolish a carefully observed head and shoulders pattern, or indeed any chart pattern.
Moreover, patterns are rarely perfectly shaped, formations are often tilted upward, or downward. There is undoubtedly an observational skill required when identifying patterns, as there are many aspects of technical analysis.
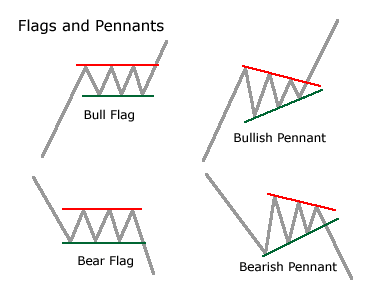
Flags and Pennants
The flag and pennant patterns can also be observed on all financially traded assets; equities, forex, commodities and bonds. The patterns are considered to be characterized by a clear direction of the price trend, generally accompanied by consolidation and a range bound movement, which is then followed by a resumption of the current trend.
The flag pattern consists of two parallel lines. These lines are flat, or pointed in the opposite direction of the dominant market trend. A pole is formed by a line which represents the primary trend in the market. The flag pattern is regarded as the market stalling, after experiencing a significant move, before then building momentum once more and continuing its primary trend.
The pennant pattern is similar to the flag pattern in both its set up and the potential impact. However, during the consolidation phase of a pennant pattern, we observe converging trend-lines, rather than parallel trend-lines.
Overall, it's recommended that traders and investors should regard flags and pennants as continuation patterns, we're looking for confirmation that an existing trend has momentum and will continue. They usually display brief pauses in an overall dynamic market. Analysts consider these patterns as some of the most reliable continuation patterns available to observe.
A simple and quick method to note bullish flags is that they're defined by lower tops and lower bottoms, the pattern generally leans against the trend, unlike wedges, their trend lines run parallel. Conversely bearish flags are comprised of higher tops and higher bottoms. Bear flags also have a tendency to lean against the trend. Their trend-lines also run parallel.
Pennants take on the appearance of symmetrical triangles, however, pennants are typically smaller in size and therefore are indicating less volatility and duration. Volume generally contracts during the pause with an increase on the breakout.