RSI forex strategy
Among the oscillator grouped indicators that tell a lot about the momentum and condition of price movement is a special leading indicator known as the “RSI indicator”.
RSI is an acronym for Relative Strength Index. An indicator that was developed by a renowned technical analyst known as Jay Wells Wielder for the purpose of identifying temporarily overbought and oversold conditions, momentum trading and identification of value among currency pairs or a traded financial instrument.
The name ‘Relative’ ‘Strength’ ‘Index’, means that the indicator compares the performance of a currency pair within a certain period to the total average performance of the currency pair price movement, thereby measuring the strength of recent price changes.
This article covers everything that you need to know about the RSI indicator, how you can apply and incorporate the RSI and its trading strategies to your technical analysis of the forex market to improve your understanding of price movement and improve your trading profitability.
What is the display description and the basic settings of the RSI indicator.
The RSI indicator is a pretty simple looking indicator with a very user-friendly interface. As with all the other oscillator grouped indicators, the RSI indicator is also plotted off the chart.
The Relative Strength Index of a forex pair is represented on the indicator by a single line that moves back and forth within a scale of 0 to 100. Between the 0 to 100 scale of the indicator is two default reference points or threshold levels of 30 and 70 which is used to determine overbought and oversold extremes of price movement.
The line representing the Relative Strength Index is calculated with a default look-back period of 14 as its input value i.e. 14 representing 14 previous bars or candlesticks. This input value can be modified to produce more or less frequent RSI signals which we would discuss more in the next subheading.
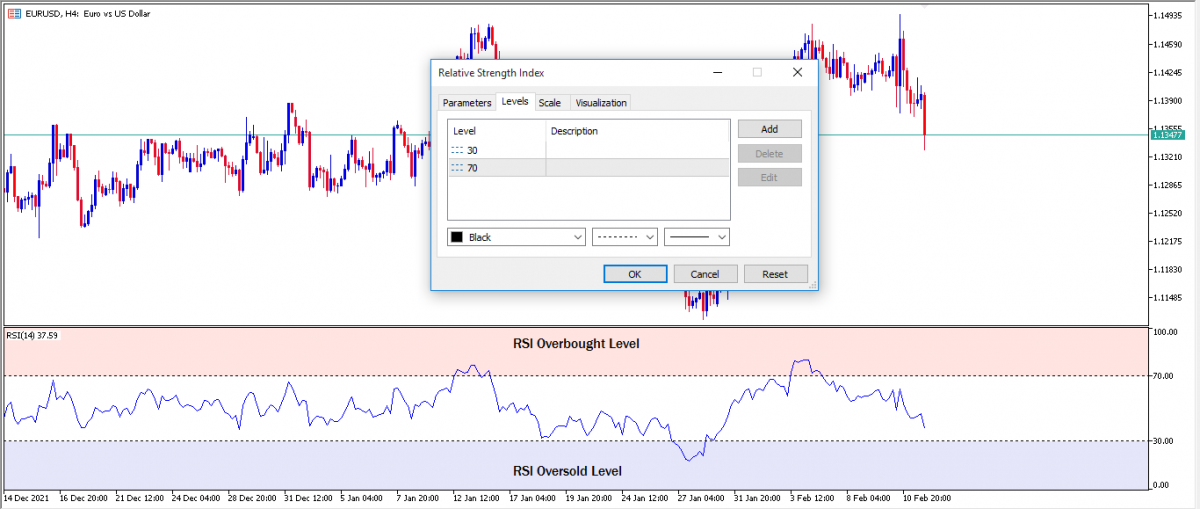
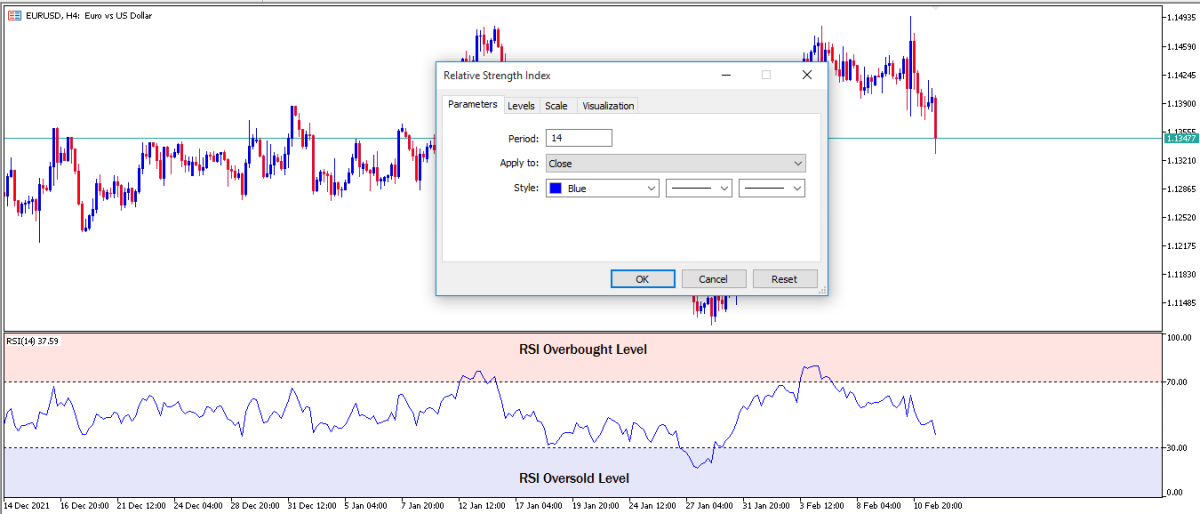
Adjusting the RSI indicator settings
The forex RSI setting can be adjusted to increase or decrease the frequency of signals produced by the indicator and also to fit different trading strategies and trading styles.
The default input value for the period look back is 14 and the default standard threshold for overbought and oversold price levels is 30 and 70.
Increasing the input value of the period lookback will decrease the frequency of overbought and oversold signals produced by the indicator.
Contrary to this, decreasing the input value of the period lookback will increase the frequency of the overbought and oversold signals produced by the indicator.
Day traders often increased the 30 and 70 threshold level for overbought and oversold reading of price movements to 20 and 80 in order to increase the accuracy, reliability and odds of overbought and oversold reversal signals.
For swing trading on the weekly and daily charts, the best adjustment made on the RSI is to change the period input value from 14 to 20.
For the RSI scalping strategy on the 1Hr to 15minute charts, the indicator needs to be more sensitive to intraday price movements and so the best adjustment for the RSI indicator is to reduce the period input value from 14 to between 9 and 5 depending on the trader comfort with the frequency of setup.
How to interpret the relative strength index signals and utilize the signals effectively as a forex RSI trading strategy
There are 3 basic signals produced by the RSI indicator commonly known as overbought, oversold and divergences in price movement.
RSI indicator forex strategies can be developed around these signals because they give traders important clues of the underlying condition of price movement at the confluence of time and price and furthermore, the signals give traders an idea of the anticipated immediate changes in direction of price movement.
- Relative strength index overbought and oversold trading signals:
On the RSI indicator if the RSI line crosses above the 70 standard threshold level on the measurement of the momentum of a bullish price move. This signal is a sign that price movement is in an overbought market condition. I.e. the current bullish price move is at its limits, extreme or breaking point.
The implication of this is that any major market impact such as news releases, a resistant level or a shift in demand to supply can easily change the direction of price movement either to a bearish reversal or to a sideway-consolidation price movement.
Conversely, if on the RSI indicator, the RSI line crosses below the opposite 30 standard threshold level on the measurement of the momentum of a bearish price move. This signal is a sign that price movement is in an oversold market condition. I.e. The current bearish price move is at its limits, extreme on the downside.
The implication of this is that any major market impact such as news releases, support level or shift in supply to demand can easily change the direction of price movement either to a bullish reversal or to a sideway-consolidation price movement depending on the strength of the market impact.
With the aid of indicators and other trading strategies, traders can make accurate predictions on either of these next directional price movements and also discern if it's a highly probable trade idea to profit from it.
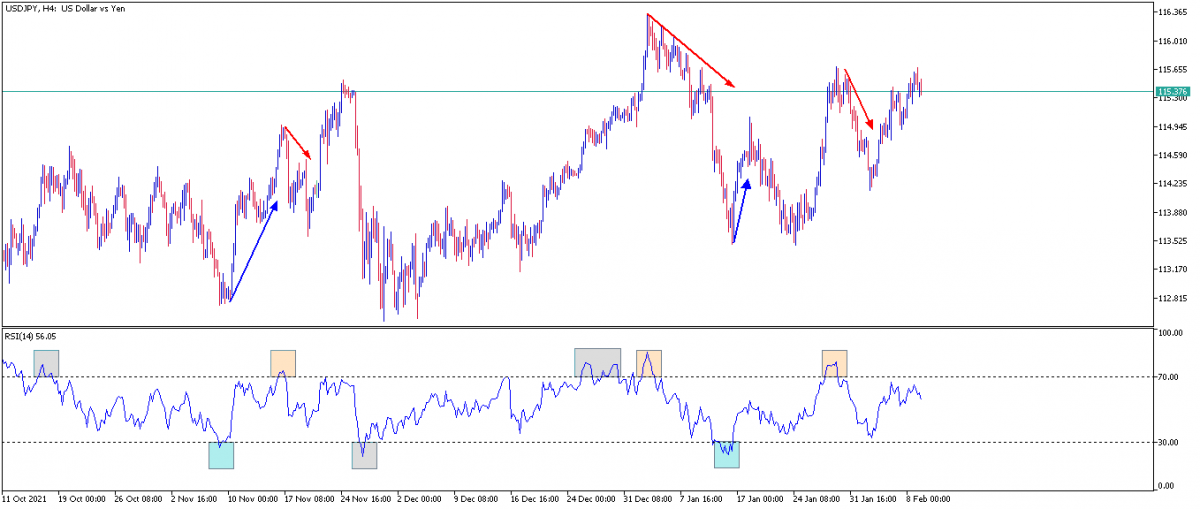
The image example above is a typical depiction of overbought and oversold signal of price movement on a USDJPY 4hr chart including both profitable and unprofitable signals.
There are 8 clearly seen overbought and oversold trade signals denoted with three different colours; grey, orange and blue.
The grey box represents low probable overbought and oversold signals that is unlikely to be profitable and might rather result in a loss.
The orange boxes represent highly profitable overbought reversal sell signal.
The blue boxes represent highly probable and profitable oversold buy signals.
- Relative strength index divergence trading signals:
Divergence is a very important concept in forex trading used to identify subtle shifts between the supply and demand of market participants. Divergence occurs when there is a crack in the correlation between the price movement of a forex pair and the direction of a technical indicator.
The RSI indicator divergence signal does just the same function in that it is used to spot the immediate unseen accumulation of long orders or short orders by the major market participants in a forex or currency pair.
Divergence signals can be identified by the RSI indicator when price movements of a forex pair are not in symmetry (that is not in sync) with the single line movement of the RSI indicator.
For example, a bullish divergence signal can be identified when price movement makes a new swing low (lower low) and the RSI indicator fails to make a corresponding lower low and instead it makes a higher low.
On the other hand, a bearish divergence signal can be identified when price movement makes a new swing high (higher high) and the RSI indicator fails to make a corresponding higher high and instead it makes a higher low.
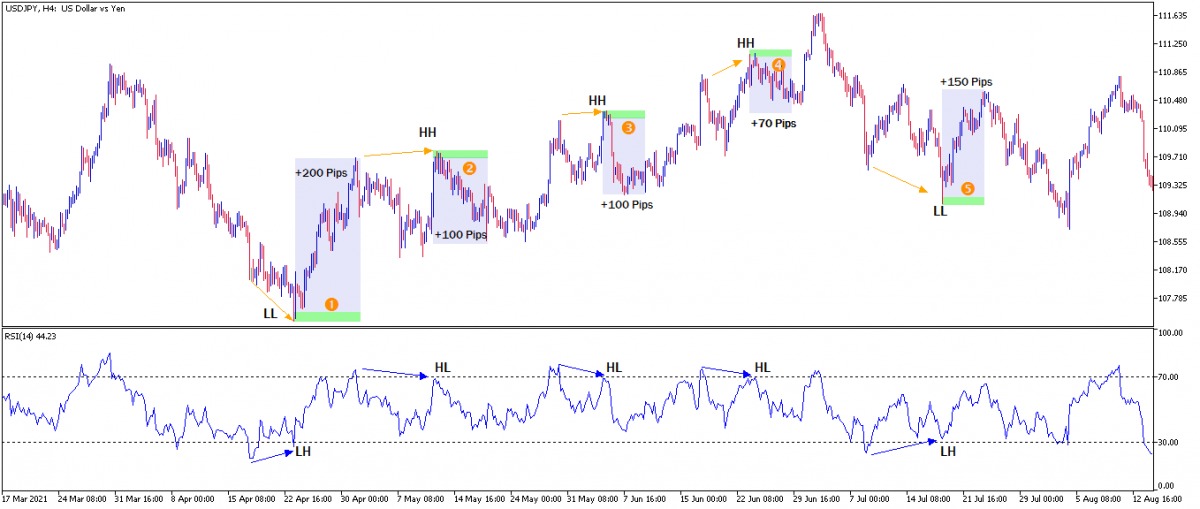
The image above is a clear example of bullish and bearish RSI divergence trade setup on USDJPY 4Hr chart. Notice that most of the divergence signals are very high probable trade setups and they all occur at the overbought and oversold RSI levels.
The first and the fifth divergence signals are bullish divergence buy setup where price movement of USDJPY made lower lows and the RSI indicator line made contrary higher lows. This crack in correlation at the oversold level of the RSI set the tone for USDJPY bullish rally in the first and fifth trade setup.
The second, third and fourth divergence signals are bearish divergence sell setups with similar unsymmetrical correlation between the price movement of the USDJPY pair and the RSI indicator signal line. USDJPY making higher highs and the RSI indicator line making higher lows at the overbought level three times consecutively set the tone for the USDJPY bearish price moves.
Challenges of the RSI indicator
Although the RSI is a leading indicator, that means the signals produced by the indicator precedes price movement. This feature makes the RSI signals unique, distinct and very useful for traders in technical analysis of their favourite pairs and picking high probable trade setups but there are some caveats to using the RSI indicator.
First is, price doesn't always turn around immediately whenever the RSI indicator reads overbought or oversold. Oftentimes at these overbought and oversold levels, price movement usually extends further.
This means that the RSI overbought and oversold signals should not be used as standalone trade ideas, that is, it is not sufficient to validate a reversal trade idea or trade setup. Therefore these signals must be confirmed with other significant or preferred indicators, the current trend and candlestick entry patterns before executing a buy or sell market order on a trade setup.
If price movement can extend even further when the RSI indicator is already indicated overbought or oversold, this implies that the RSI interpretations of price movements can be used as a significant starting point of technical analysis or a trading plan to scout for profitable overbought and oversold reversal trade setup.
Click on the button below to Download our "RSI forex strategy" Guide in PDF
