Technical analysis basics: support, resistance, and trendlines
Technical analysis depends on price chart analysis to detect market patterns which enable predictions about upcoming market trends. The method of technical analysis differs from fundamental analysis because it does not use economic or financial data to make predictions. The method operates under the assumption that price and volume data contain all available market information. The three essential tools for market behavior analysis include support levels and resistance points and trendlines. These tools assist traders in identifying potential areas of increased buying or selling interest and momentum slowdowns and provide them with decision-making frameworks.
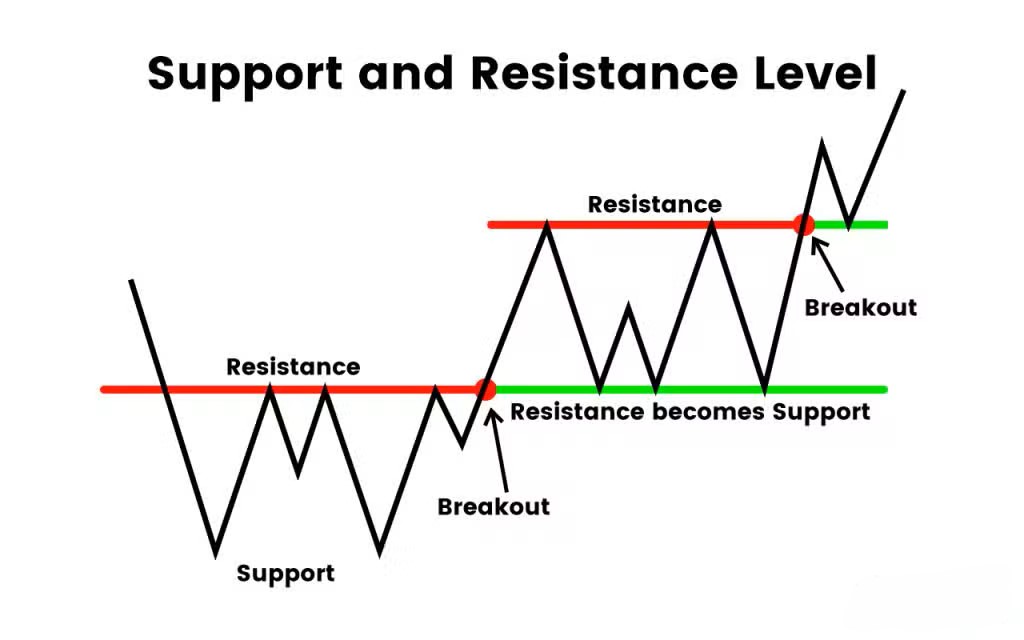
The market begins to rise after demand surpasses supply in areas which are called support zones. Resistance is the opposite—levels where supply has consistently capped price advances. The market direction becomes apparent through trendlines which connect these reactions across various time intervals. The method of drawing a line across multiple higher lows in an uptrend enables traders to determine if market momentum continues to rise or begins to decrease.
Core concept
The most exact method to detect support and resistance levels exists through price zones instead of treating them as individual points. The support level functions as a price zone that market forces have continuously interrupted downward price movements to create a floor. The Resistance level functions as a mirror image which indicates the highest point that price action can reach before it starts to decline. The levels develop from swing highs and lows that occurred in the past when numerous market participants made their trading decisions.
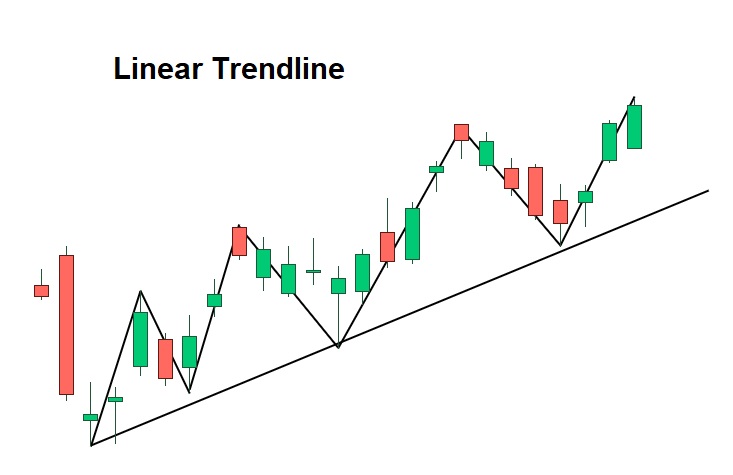
The visual connection between price points in a sequence becomes possible through trendlines which create structure in the data. An uptrend line connects two or more rising lows and a downtrend line joins descending highs. The analysis of currency pair momentum needs a line to be drawn from the higher lows at 1.0800 and 1.0850 to check if price momentum stays strong. The line becomes more reliable after the system detects three or more touches.
The concept of polarity functions as a useful tool. The price level that acts as resistance will shift to become support after a successful price move above it. The breakdown of support structures will eventually lead to opposition. The behavior enables traders to detect when market control passes from buyers to sellers.
How to find support & resistance
Support and resistance levels often become clearer by looking at past price behavior. Swing highs and swing lows serve as market reversal indicators which traders can identify through marking these specific points. The area at 1.0700 functions as support because the currency pair has shown multiple instances of price increases at this particular level. The level of 1.1000 serves as resistance when price fails to break through this point multiple times.
The analysis of closing prices works best when performed on daily or weekly chart timeframes. The different levels of data hold importance because numerous participants who include institutions use end-of-session data to make their decisions. The strength of the signal increases when analyzing data over longer periods yet shorter periods tend to include more random fluctuations.
The results show an impact from the use of round numbers. The EUR/USD pair shows price movements near specific psychological levels at 1.1000 and 1.0500 in the forex market. The market interest exists at these levels because traders place their orders at simple numbers. The combination of historical swing points with psychological levels provides traders with a more detailed understanding of potential support and resistance areas.
Drawing reliable trendlines
The market trendlines help investors determine if the market is moving in an upward direction or downward direction or remaining stable. Begin your drawing work by establishing at least two fundamental price points. The trend analysis method requires the connection of rising low points from an uptrend to falling high points from a downtrend. The first uptrend line forms when traders link the lowest points of the currency pair at 1.0750 and 1.0820. The line becomes more reliable after a third touch confirms its presence.
Consistency matters. Some traders use candlestick wicks, while others prefer closing prices, but whichever method is chosen should be applied the same way across charts. The main error occurs when traders attempt to make a line conform to price movements. The market validity of the line will expire when the line reaches a breakthrough point or shows continuous overshooting.
Parallel channels can also be drawn by replicating the trendline on the opposite side of price action. The analysis helps to determine which areas need to be targeted and where the risks are located. The proper method of drawing trendlines helps traders establish market structure while reducing uncertainty which enables them to develop systematic trading strategies.
Validating levels: volume and confluence
Each support or resistance level exists with its own distinct value. The evaluation of these areas depends on the measurement of volume changes that occur in the surrounding areas. The market shows active buyer interest when prices approach support levels and trading activity rises during market recovery periods. The market will keep moving upward because prices rise above support levels and trading activity stays strong.
The system becomes more dependable when Confluence is integrated. A single perception emerges from the brain when different signals converge into the same brain area. The 1.1000 level functions as a horizontal resistance zone because it aligns with both a descending trendline and a widely used moving average indicator. Price ranges gain greater importance for traders because multiple trading tools show the same price values.
The market uses moving averages and pivot levels as dynamic indicators which function as short-term support and resistance levels. A thorough evaluation of price level strength needs a methodical process which combines price zone analysis with volume data and technical indicator assessment.
Breakouts, retests, and failed breaks
The price exceeds established support or resistance zones to trigger a breakout event. A breakout from a level shows price action momentum but not every price move above a level indicates actual price movement. Volume observation serves as a method to identify the difference between the two. EUR/USD breaks above 1.1000 when trading volume increases thus providing stronger confirmation than when the price moves with low trading activity.
A common market behavior after a breakout is the retest. This happens when price returns to the broken level to check whether it now holds in the opposite role. The pair would experience a price drop toward 1.1000 after the initial break of resistance at this level. The trading system becomes more dependable when the level functions as support because this leads to better decision-making confidence among traders.
A failed break occurs when the price moves through a level before reversing direction. These false signals tend to trap traders while creating rapid price movements in the opposite direction. The identification of breakout quality and retests and failed moves helps traders to manage their risk exposure and avoid premature market entries.
Multiple-timeframe analysis
The evaluation of markets across different time periods enables better decision-making while minimizing random market fluctuations. The assessment of major support and resistance levels requires analysis of charts that span both weekly and daily time intervals. The weekly chart shows a strong resistance zone above EUR/USD which could restrict its upward movement.
The system operates with two different time frames of four hours and one hour to achieve exact market entry and exit point adjustments. The daily chart shows 1.1050 as the current resistance level. The one-hour chart shows a clear consolidation pattern below the level which could indicate if the market will break out or reject the level.
The top-down method promotes uniformity in the organization. The system prevents traders from making decisions based on short-term signals because it directs trades according to the overall market trend. The implementation of multiple-timeframe analysis helps risk management because it allows traders to set stop-loss levels based on robust chart patterns from longer time frames rather than depending on short-term price fluctuations.
Limitations, and how to stay honest
The three technical indicators of support, resistance and trendlines offer useful structure but they do not function without errors. One common limitation is subjectivity. Traders establish their lines at various points which results in conflicting analysis results. The analysis of candlestick patterns leads to different conclusions because analysts focus on different elements such as wicks or closing prices.
The ability to make correct predictions becomes impaired by hindsight bias. Levels can appear obvious after price has reacted, but predicting them in advance is less certain. The need to establish precise rules becomes essential because it prevents players from making changes to lines for the purpose of fitting previous moves. The market environment goes through continuous changes during different time periods. The level which used to provide dependable support will become less important because market liquidity and trading patterns keep shifting.
False signals are another risk. The price may experience a short-term movement above or below a level before returning to its original position which generates false signals that can confuse traders. Risk management systems function to reduce the extent of damage from such occurrences. The combination of stop-loss orders and position sizing methods and multiple trading tools enables traders to reduce their reliance on individual indicators.
