TECHNICAL ANALYSIS - Lesson 8
In this lesson you will learn:
- What is Technical Analysis
- The basic principles of identifying trading opportunities
- Introduction to Support and Resistance Levels
Technical analysis, as opposed to Fundamental analysis, has the focus on the instrument price chart. It takes into consideration the momentum, movement of the price and the structure of the market, in order to find patterns that lead to possible outcomes.
In order to use technical analysis, one must be able to recognize patterns and develop confidence in the statistical edge. Technical analysis is built on the main principle of trend, however there are other three basic principles that are used in identifying trading opportunities:
- The market discounts everything
- Price moves in trends
- History repeats itself
The Market Discounts Everything
What this sentence means is that, any given factor that affects the price is reflected in the price, including the fundamentals, such as economic and political factors, supply and demand, etc. However, technical analysis concentrates not on the reason of the price change, but the up or down movements of the actual market price.
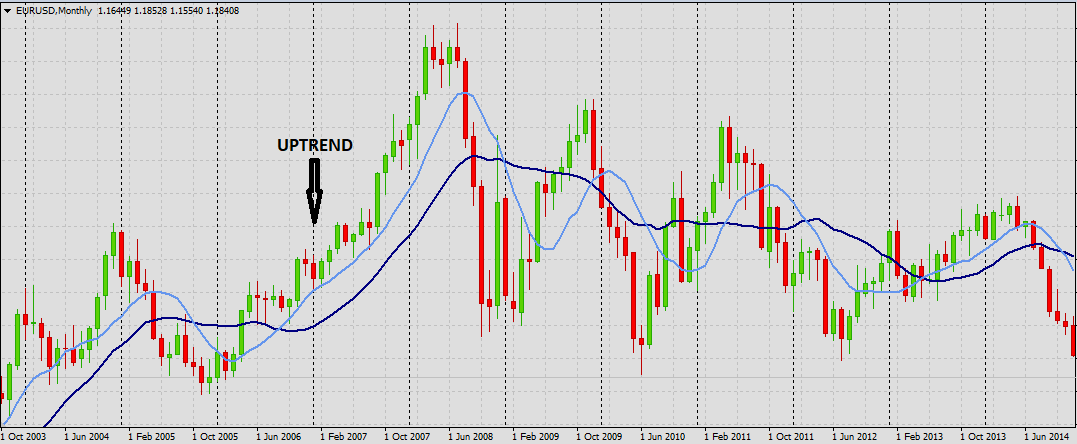
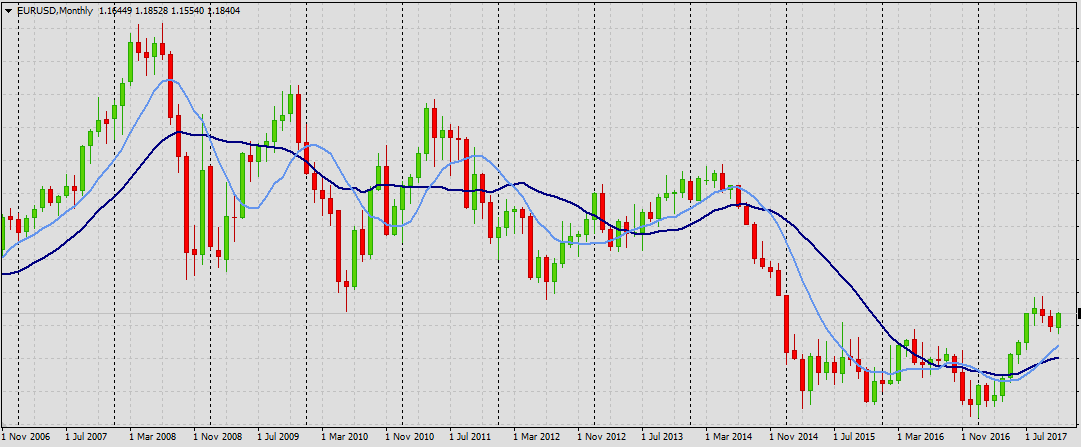
Price Moves in Trends
This is an important principle as the price trends. Trend analysis is an important part of Technical Analysis, due to the fact that it can provide an overall direction of the price, taking into consideration that the market is in trending mode most of the time. Therefore, the trend will move in the price direction or will be in a sideways mode (no clear trend identified).
History Repeats Itself
This principle refers to human psychology, which states that people will not change their behavior. In other words, people tend to rely on history repeating itself, believing that various patterns in charts or any other actions that took place in the past are going to happen in the future as well. Charts have a tendency of forming shapes that have occurred previously and analysis the past patterns helps the traders to possibly predict the future movement of the market.
In addition to the basic principles previously described, Technical analysts also utilize the support and resistance levels, also known as pivot points.
A support level is a level at which price tends to find support as it falls. This can mean that price is more likely to bounce off this level, as opposed to breaking through it. However, once the price has breached this level, by a significant amount, then it may continue falling until meeting another support level.
A resistance level is simply the opposite of a support level; price tends to find resistance as it rises. Again, this means that the price is more likely to bounce off this level as opposed to breaking through it. However, once the price has breached this level, by a significant amount, then it is likely to continue rising until meeting another resistance level. The theory is that the more often a support and or resistance level is tested (touched and bounced off by price), the more significance is given to that specific level if the price breaks through.
If price is moving between support and resistance levels, then a basic investment strategy commonly used by traders, is to buy at support and sell at resistance, then short at resistance and cover the short at support. In short if price then breaks above R1 it's considered that bullish market conditions exist, if price breaks below S1, then bearish conditions exist.
There are three common levels of support and resistance, naturally each one is regarded as a more extreme level. R3 and S3 are not reached as often during each trading day as R1 and S1, which can be breached regularly. A rough rule of thumb is that for R3 or S3 to be hit it would represent in excess of 1% price movement, for a currency pair to move that much in a trading day is a relatively rare occurrence.
There are many strategies traders will use to trade using support and resistance only and for novice traders this form of trading offers up some excellent opportunities to learn how to trade, particularly in the Forex industry. For example; only buying at or above R1 resistance and selling at or below S1 support, makes an excellent basis for decision making; we'd only take a buy trade above resistance (in bullish conditions) and sell in bearish conditions. We may use the levels of support and resistance to place our stops, being mindful of our overall position size.
