TECHNICAL INDICATORS - Lesson 9
In this lesson you will learn:
- What are Technical Indicators
- How Technical Indicators work
- The four main groups of Technical Indicators
Perhaps the most attractive and fascinating form of technical analysis available to traders concerns technical indicators. The MACD, RSI, PASR, Bollinger bands, DMI, ATX, stochastic, etc. are phenomena that have wide appeal to traders of all levels of experience. The appeal of indicators is that they often make trading look so simple to the inexperienced, you'd simply enter, exit or modify when the indicator delivers a signal.
Repeating the instruction the signal delivers over a reasonable period of time, may possibly deliver positive results and there is empirical evidence available that such a strategy may deliver profits. As an example traders might use the MACD (moving average convergence divergence) indicator to sell and buy, or simply close a trade, when a convergence/divergence signal is generated, at the top and the bottom of the indicator.
However, many traders would argue that such profits can only be delivered with a full understanding of risk and money management and indeed that any technical indicator could be utilized to deliver consistent results, if the other two factors are managed correctly.
One underrated and understated appeal of indicators is the ease of which they can be readily applied to automated trading strategies through, for example, the MetaTrader platform.
There are four main groups of technical indicators: trend, momentum, volume and volatility. These technical indicators are designed to illustrate to traders and investors the trend, or direction of the security they're trading.
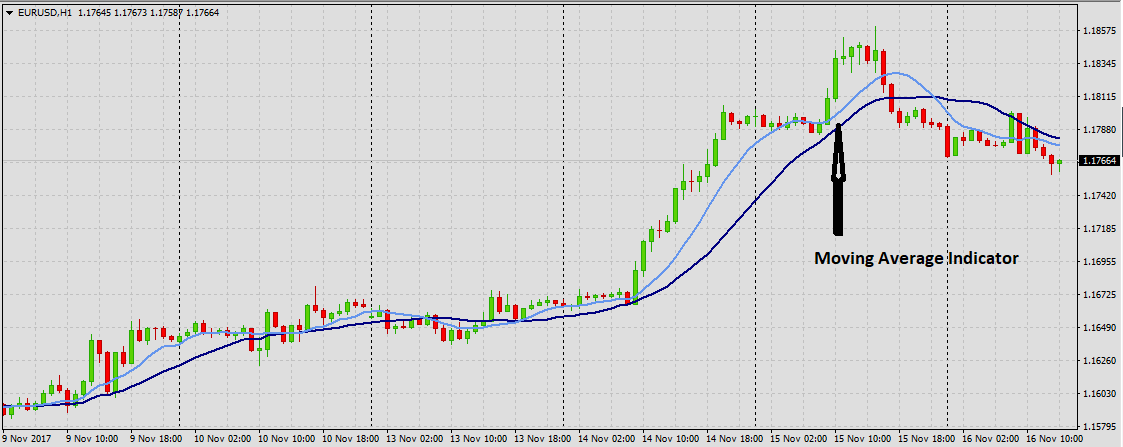
Trend Indicators
The trend of an asset can be either downwards (bearish trend), upwards (bullish trend), or sideways (no clear direction). Trend followers are examples of traders who use trend indicators to analyze the market. Moving averages, MACD, ADX (average directional index), parabolic SAR, are examples of trend indicators.
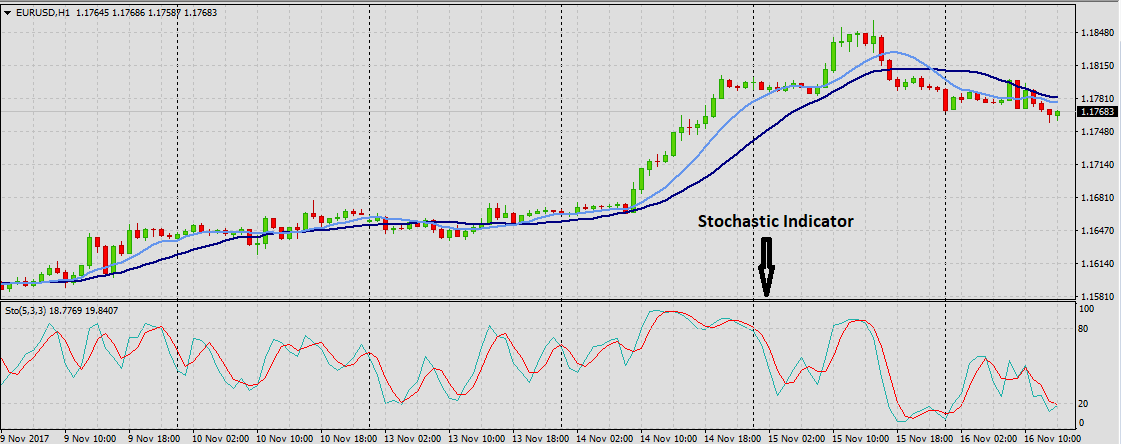
Momentum Indicators
Momentum is a measure of the speed at which the value of a security is moving over any given period of time. Momentum traders will focus on securities which are moving significantly in one direction due to high volume. Momentum indicator examples are: RSI, Stochastics, CCI (Commodity Channel Index).
 Volatility Indicators
Volatility is an extremely important issue in trading, traders can discover several indicators which can measure volatility, or use it to generate signals.
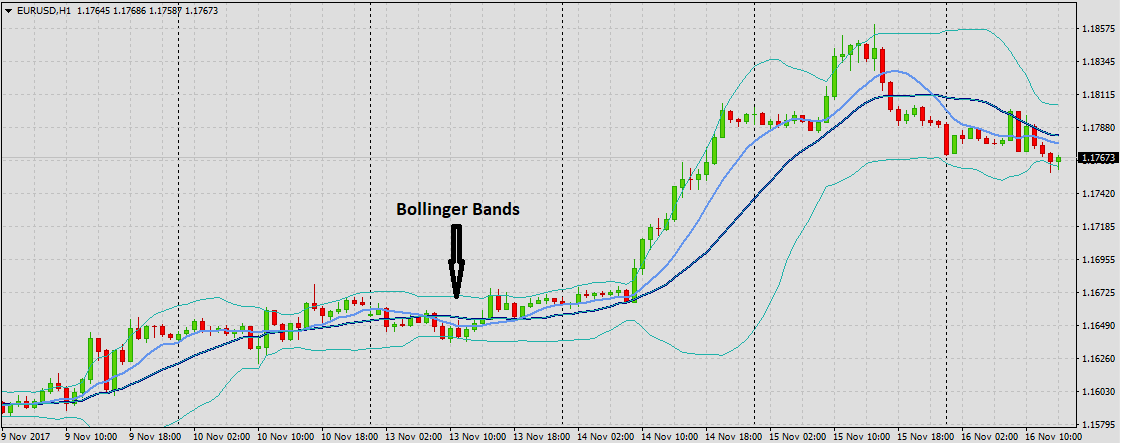
The volatility is the relative rate at which the price of a security moves (up and down). A high volatility occurs when the price moves up and down quickly over a short period of time. If the price moves slowly then we can consider that the specific security has a low volatility rate.
Some of the volatility indicators available for traders are Bollinger bands, Envelopes, Average true range, Volatility channels indicator, Volatility Chaikin and Projection oscillator.
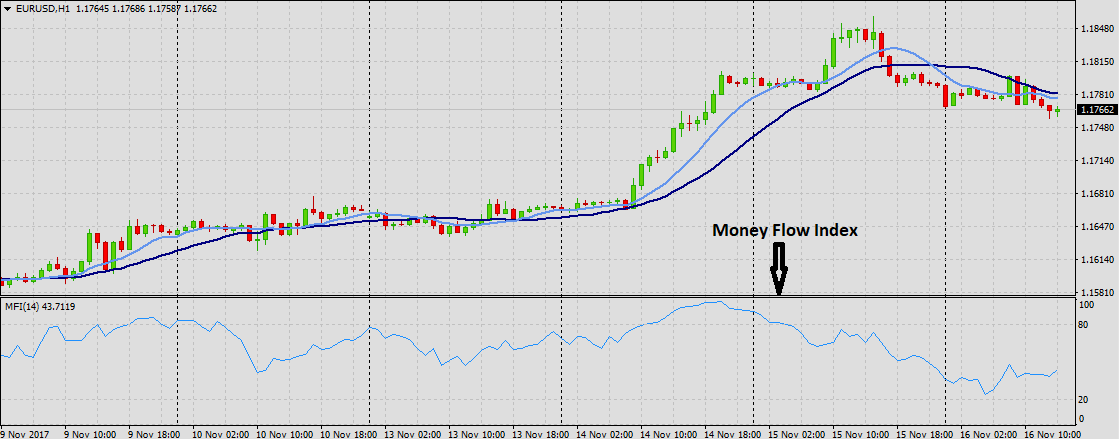
Volume Indicators
The volume of trades being executed in the market is an extremely important factor when trading. It can be used, for example, to confirm or negate a continuation or a change in a security's direction. Many indicators are based on volume. For example, the Money Flow Index is an oscillator linked to volume, which measures the buying and selling pressure using both price and volume. Other volume indicators include: Ease Of movement, Chaikin money flow, Demand index and Force index.