The Best Forex volatility indicator and How to use it
Forex traders need to consider certain concepts when trading foreign currencies. Understanding volatility and how it affects the price movement of forex currencies is one of the key fundamental aspects of forex trading.
The perception of what volatility really means differs from trader to trader. For instance, traders who specialize in short-term trading may measure volatility by the speed at which a trade can turn profitable and reach a profit objective. To others, volatility is a measure of the liquidity of the market and the speed at which price movement changes.
Volatility is quite discouraging to risk-averse traders, but for others, it provides numerous opportunities to profit from price fluctuations that are quick and frequent.
The best way to avoid being caught off guard by market volatility and the changes in the direction of price movement is to trade in alignment with your best understanding of market trends.
The benefit of using forex volatility indicators?
If you want to capitalize on the volatility of the forex market, it’s helpful to lean on popular volatility indicators that can help you make sense of the chaos of price movement. There are Forex volatility indicators that help to gauge the volatility of a currency pair and to judge whether a forex pair suits a trader's hunt for profits. Depending on what kind of trader you are, if you are looking for a steady, quiet ride then a currency pair with comparatively low volatility may suit you best but if you are a short-term or contrarian trader, you should seek a more volatile market.
Beyond determining the quality of a market's volatility, forex volatility indicators have more specific uses, such as:
- Predicting trend reversals
- Measuring trend strength and momentum
- Identifying possible breakouts from ranges and consolidating price movement.
If you are wondering which Forex volatility indicators are available on the MetaTrader trading platforms (MT4 and MT5), the answer is that there are several available. Therefore, it is important to note that not all the Forex volatility indicators have the ability to perform your specific need because different volatility indicators measure volatility in different ways hence they are better suited for one purpose than the other.
The indicators are listed as follows:
- The Parabolic SAR
- The Average True Range indicator
- The Momentum indicator
- The Volatility channels
- The Parabolic SAR: Abbreviated as Parabolic Stop and Reverse, was designed by J. Welles Wilder to identify good entry and exit price levels for trade setups. It was designed only for trending markets and is, therefore, not as effective in side-way price movement or consolidations. In that case, to yield highly probable trade signals, the Parabolic SAR may be combined with a trend-following indicator.
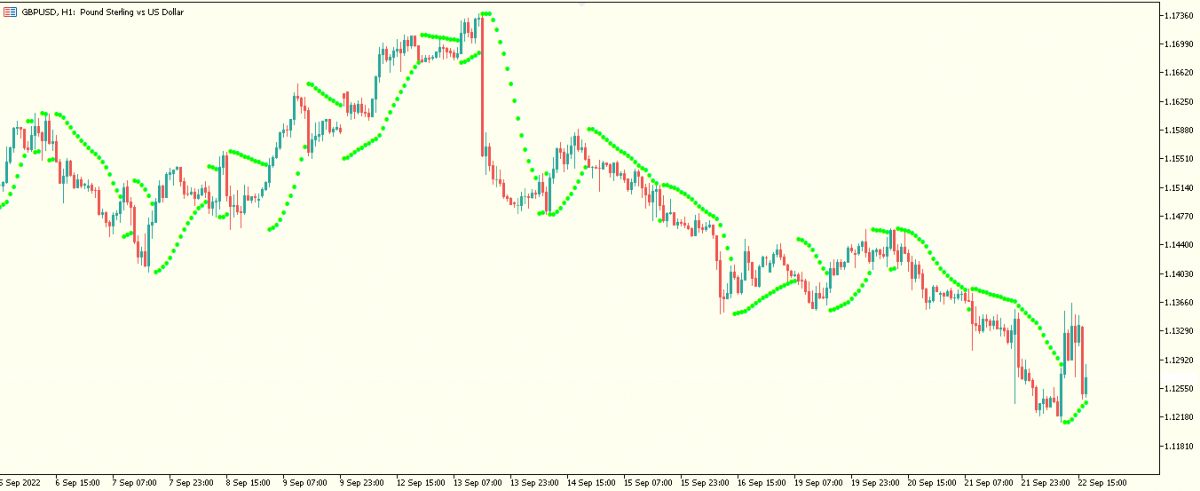
GBPUSD chart above, the indicator plots curves, or parabolas over price movements.
What is the formula for calculating the Parabolic SAR?
By using the Parabolic SAR, traders can navigate volatile conditions and identify potential trends. In trending markets, price movements are likely to move within the plotted curves of the indicator otherwise it is possible that the trend has ended if prices move beyond the curves.
The formula for calculating the Parabolic SAR for a day ahead:
(EP – SAR today) x SAR today + AF = SAR tomorrow
The ‘Acceleration factor’ is abbreviated as AF.
EP is abbreviated as extreme point, which is the difference between the highest price level of an uptrend and the lowest price level of a downtrend.
The acceleration factor is set at an initial value of 0.02 by default but you may find a different value that works better. These findings must be carried out only on a risk-free and demo trading account.
The value of the acceleration factor changes constantly by a 'step' (the initial value of the AF) as price movement makes new highs and new lows.
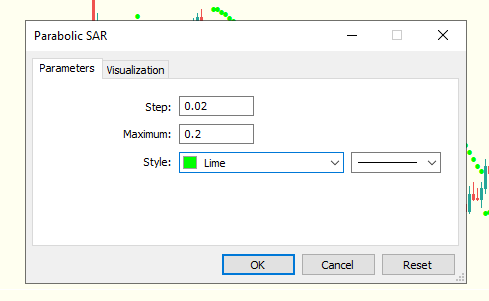
According to the above image, the default value of this maximum in MetaTrader platforms is 0.20.
The general guidelines for using this indicator can be summed up in two points:
- In the event that the SAR dots appear below the current price movement, this indicates an uptrend but if it appears above the current price movement, it suggests an imminent downward trend.
- When the dots cross from above to below, it indicates a buy signal but if the dots cross from below to above, it suggests a sell signal.
- The ATR (Average True Range) indicator
The ATR is a technical analysis indicator developed by J. Welles Wilder Jr to measure market price movements. It was designed for use in commodity markets but has since been extended to all other financial market instruments.
It is calculated by taking the simple moving average of a sequence of true ranges over a period of 14 days. The ATR indicator measuring a shorter time period than 14 days is likely to produce more signals, while longer time periods are more likely to generate fewer signals.
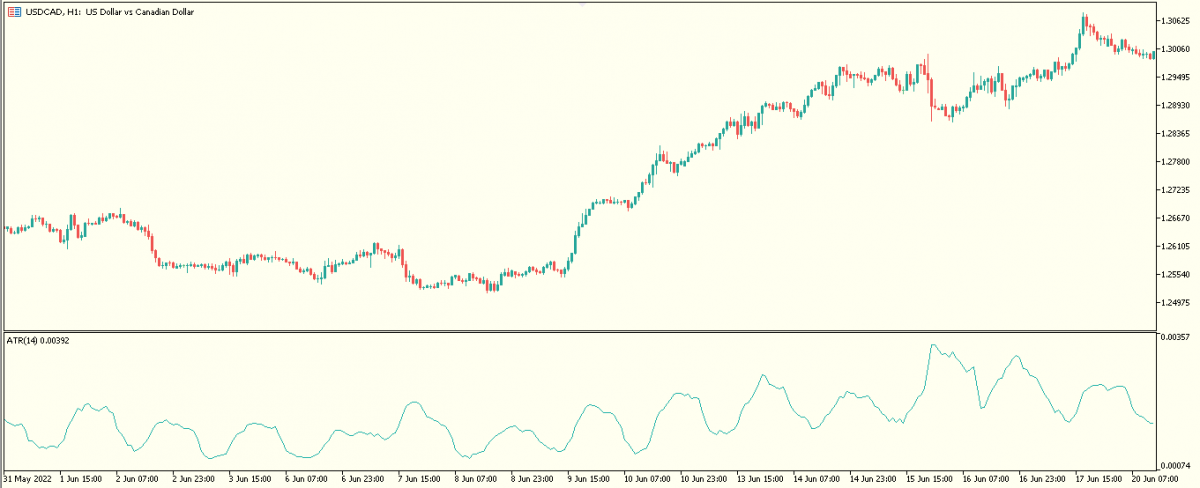
Average true range (ATR) of USDCAD price movements
Using the ATR indicator has the disadvantage of being a statistical metric that can be interpreted in different ways but simply stated, price movement with a high level of volatility has a higher ATR and price movement with lesser volatility has a lower ATR. Furthermore, there is no ATR value that will tell you whether or not price movement or a trend is going to change direction.
- The Forex Momentum Indicator
The momentum indicator, sometimes called the Rate of Change indicator (ROC), measures how quickly price movement changes. Moreso, the indicator measures the force behind any price expansion. It also helps to identify possible market reversals by measuring the strength and weakness of price movement.
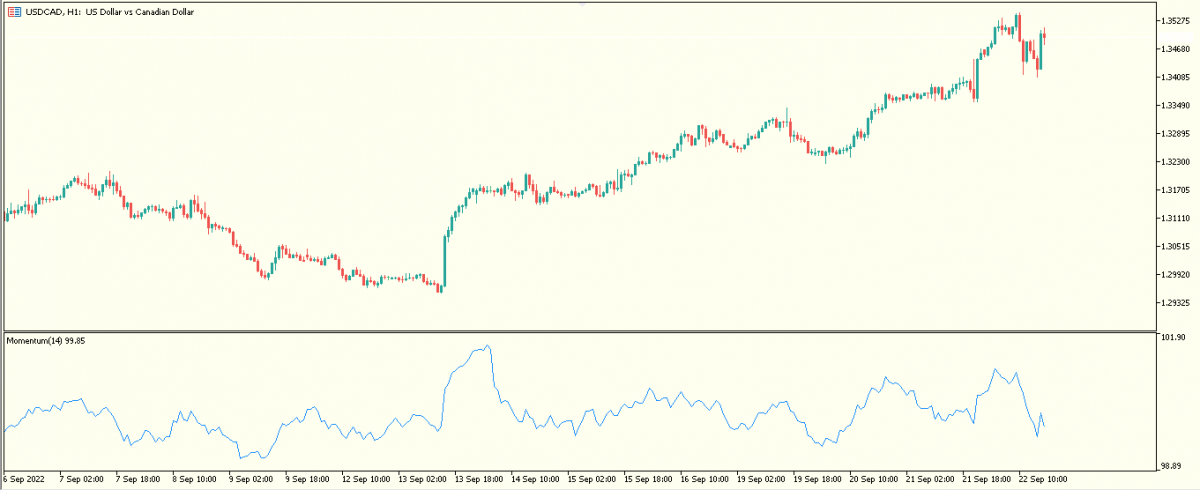
USDCAD chart with momentum indicator plotted below price movement.
The indicator's value tells about the percentage rate of change of price movement with this formula,
Momentum = (current close – close of N period) / (close of N period x 100)
Where 'N' is a certain duration of time with a default value of 20.
The more positive the value of the momentum, the stronger the price movement to the upside. Conversely, the more negative the value of the momentum, the stronger the downside price movement will be.
Therefore, we can make the following assumption; It is reasonable to expect the trend to continue as long as the momentum value remains high. However, if the value of the momentum begins to drop toward 0, this is a sign that the trend is waning.
Based on this, we can draw the following conclusion that
- The momentum indicator crossing from a negative to a positive value is a buy signal
- The momentum indicator crossing from a positive to a negative value is a sell signal.
- The volatility channels
Volatility channels are a type of overlay indicator that plots volatility lines above and below price movement. These lines are a form of channels, envelopes or bands that widens as volatility increases and contract as volatility decreases.
A very popular volatility channel indicator is the Bollinger Band, but the Keltner Channel Indicator is yet another.
Among all the volatility channel indicators developed and readily available on trading platforms, the Bollinger band created by John Bollinger in the early 1980s have become the most popular and well-known volatility indicator in the financial market.
The indicator plots three lines around price movement with
- A simple moving average (with a default value of 20) as a middle line that is enclosed by two other lines.
- The two other lines form the boundaries of the band and are equally distanced, with an upper and lower line that expands and contracts in response to changes in market volatility. When the market volatility increases, the band expands significantly but a low volatile market causes the band to constrict.
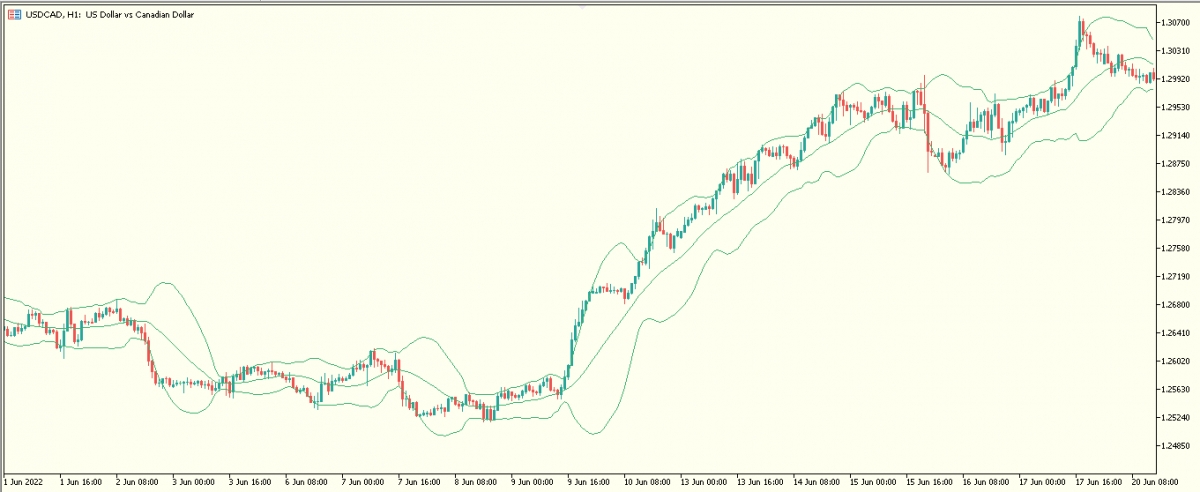
Bollinger band around price movement of USDCAD chart
Traders can adjust the default values of the band according to their preferences. When price movement is near the upper line of the band in an uptrend, the market is considered overbought. Conversely, in a downtrend, when the price movement is at the lower line of the band, the market is considered oversold.
Which among these Forex volatility indicators is the best?
There is no consensus among forex volatility indicators regarding which is the best, and it depends on what each trader finds comfortable and suitable for their trading style.
In general, indicators work better when used in conjunction with another. An example of a powerful strategy is to combine two indicators, the Bollinger band as a primary indicator to indicate overbought and oversold conditions in price movement, then the momentum indicator as a secondary indicator to confirm a bullish or bearish reversal.
Thanks to this volatility indicator guide, it can be used to find the best forex volatility indicator (among the 4 above) that suits your trading style. You must practise with these indicators on a risk-free demo account and stress test which of these indicators is the most efficient and profitable for your trading style.
Only through practice, you can start to make more informed volatility-based trading decisions and risk management practices.
Click on the button below to Download our "The Best Forex volatility indicator and How to use it" Guide in PDF
