UNDERSTANDING PRICE ACTION - Lesson 2
In this lesson you will learn:
- What is Price Action
- The basic Japanese Candlesticks
- How to make trading decisions based on the Candlesticks Change
Many experienced and successful traders will only use price action on their charts, in order to identify where price may be headed. They'll perhaps use pin bars, or more likely basic Japanese candlesticks, whilst keeping aware of economic calendar events only, observing how the candlesticks change and the various volume and appearance of these candlesticks, to make their trading decisions.
Basic Sentiment Candlesticks
Doji
The Doji is arguably the most recognized, easily identifiable and referred to candlestick in trading, it's characterized by taking on the appearance of a perfectly symmetrical cross, visualizing it as perfectly balanced scales may also be an appropriate label. When we observe a Doji candlestick, we're recognizing that price is unchanged.
The Doji is absolutely crucial because it represents market indecision; the weight of opinion and thereby orders from traders in the market, appears to be finely balanced on a scale, therefore price could either reverse, or pause and then continue in its current direction.
Marubozu
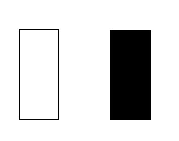
A Marubozu candlestick is the exact opposite of a Doji. It's easily identifiable as a full candlestick with no shadows, or 'tails'. It's a definitive block and indicates that traders are either extremely bullish, or extremely bearish. The opening and closing price of a Marubozu are at the extreme ends of the candlestick. A Marubozu candlestick which closes higher signifies powerful bullish strength, alternatively one that closes lower indicates considerable bearishness. This candlestick is not necessarily a candlestick to base a new trading decision on, more likely it confirms the direction a trend, or a developing trend.
Reversal Candlestick Patterns
Harami
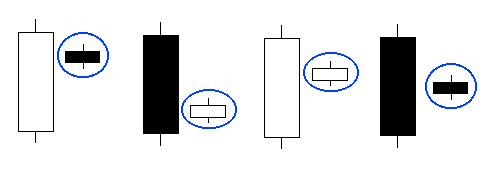
The word Harami has many meanings in various languages, the direct English translation is "pregnant" from the Japanese language. In terms of observation of candlestick patterns this is highly appropriate, as the mother candle appears to have a baby as the second candlestick. It's advisable to focus on the bodies of these consecutive candles. The body of the small (baby) bar must be entirely within the body of the mother bar in order for confirmation. Typically, for a bullish Harami formation to exist, the first bar closes lower than it opens, whilst the second bar closes higher. Conversely in a bearish Harami, the first bar closes higher than it opens, whilst the second bar closes lower.
This candlestick pattern generally means that the market in question has come, or is coming to a potential reversal. The candle body represents price change regardless of its movement as the complete candle is developing, it represents conclusive movement of the candlestick and the smaller of the candles points to decreased volatility, many Harami are inside bars.
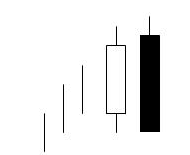
Engulfing Candlestick
This is one of the most identifiable, searched for, observed and traded patterns when using candlesticks. We simply flip the standard Harami pattern horizontally and we receive the engulfing pattern. In simple terms the body of the second candle, completely engulfs the body of the first.
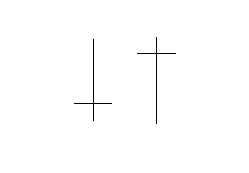
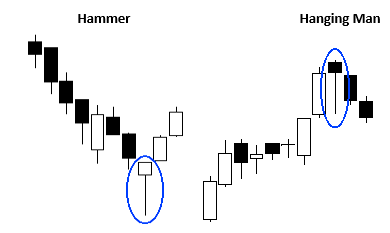
Hammer and Hanging Man Candlesticks
The hammer and the hanging man patterns are identical. Both have candle bodies near the top of the candlestick and long lower shadows, generally around twice the size of the candle body, the color of candlestick is irrelevant. Although identical in appearance there's a critical and key difference between the two formations. The hammer pattern is generally observed after a market decline and is therefore a bullish signal. Whereas the hanging man appears at the end of a bullish movement and is a bearish signal.
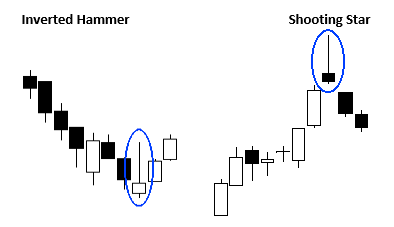
Inverted Hammer/Shooting Star
The inverted hammer is the exact reversal of the hammer candlestick, we simply invert the hammer pattern and the inverted hammer is visually identical to the shooting star pattern.
The key difference, when looking for trading opportunities, is where you'd find these candlesticks. The inverted hammer is found at the end of a downtrend, whereas the shooting star is found at the end of a uptrend.
The inverted hammer is regarded as a bullish pattern. In a down trend the pattern offers up confidence for sellers, when the inverted hammer fails to push the market down, the bullish reaction can often be dramatic.