Wedge chart pattern
In the realm of forex trading, the significance of chart patterns cannot be overstated. They play a pivotal role in helping traders decipher market trends and anticipate price movements. These patterns aren't mere random lines and shapes on price charts; instead, they represent systematic formations that offer invaluable insights into market behaviour.
One such chart pattern that has gained recognition for its reliability is the Wedge Chart Pattern. This dynamic formation indicates the potential for either a trend reversal or continuation. It stands out with its characteristic convergence of two sloping trendlines – one representing support and the other resistance. What makes this pattern even more intriguing is that it can be observed in both rising and falling market conditions.
Understanding wedge chart patterns
The Wedge Chart Pattern is a visual representation of impending price movements. This pattern forms when two trendlines, one upward-sloping and the other downward-sloping, converge. These trendlines encapsulate the price action within a narrowing range, symbolizing a temporary equilibrium in the market's bullish and bearish forces.
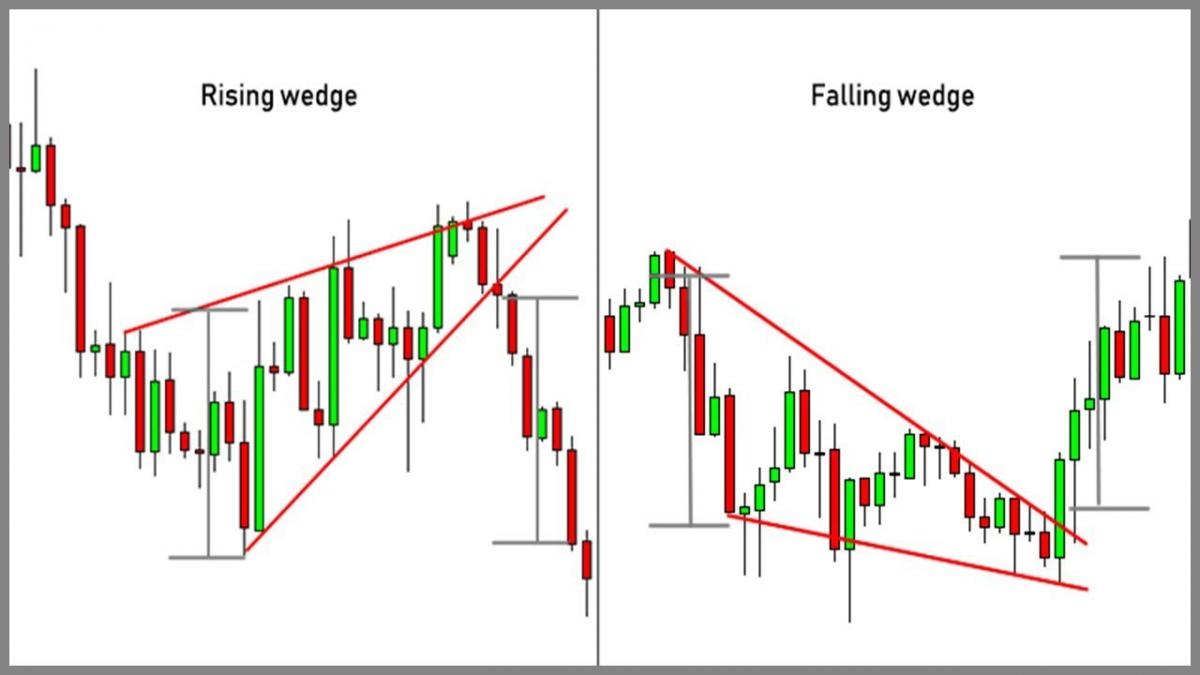
Rising Wedge Pattern: In a rising wedge, the upper resistance line slopes upward while the lower support line slopes upward as well, though at a steeper angle. This pattern suggests a potential bearish reversal, as buying pressure weakens within the narrowing range, often leading to a breakout to the downside.
Falling Wedge Pattern: Conversely, the falling wedge exhibits a downward-sloping upper resistance line and a steeper downward-sloping lower support line. This pattern indicates a possible bullish reversal, as selling pressure diminishes within the contracting range, often culminating in an upward breakout.
Sloping Trendlines: Both rising and falling wedges are characterized by the converging trendlines, which visually represent the narrowing price range. The angle and slope of these trendlines are crucial for pattern identification.
Converging Support and Resistance Lines: The convergence of the two trendlines signifies a reduction in volatility and a potential price breakout in the near future. Traders monitor this point of convergence for signals.
Volume Analysis in Wedge Patterns: Volume analysis plays a significant role in confirming the validity of a wedge pattern. Typically, decreasing trading volume within the pattern suggests weakening interest, potentially foreshadowing a breakout direction.
How to identify wedge chart patterns
Recognizing Wedge Chart Patterns on forex charts is a valuable skill that can greatly enhance a trader's ability to make informed decisions. Here is a step-by-step guide to identifying these patterns:
Using Trendlines to Identify Slope: Begin by selecting a forex chart that aligns with your trading timeframe. To spot a Wedge Chart Pattern, draw trendlines along the peaks (resistance) and troughs (support) of the price action. In the case of a rising wedge, the upper trendline should have a gentler slope compared to the steeper lower trendline. Conversely, in a falling wedge, the upper trendline will be steeper than the lower trendline. This contrasting slope is a key indicator of the pattern.
Confirming Convergence of Support and Resistance: The hallmark of a Wedge Chart Pattern is the convergence of its support and resistance lines, leading to a point where they meet. As the price oscillates between these lines, the range narrows, indicating potential market indecision. Traders should focus on the point where the trendlines intersect, as it often precedes a breakout.
Analyzing Volume Changes Within the Pattern: Volume analysis is a crucial aspect of confirming a Wedge Chart Pattern. As the pattern develops, observe the trading volume. Typically, you will notice declining volume within the wedge, indicating reduced enthusiasm from market participants. This decrease in volume supports the idea of an imminent price breakout.

Trading strategies for wedge chart patterns
Wedge Chart Patterns offer forex traders distinct trading opportunities that can be harnessed through two primary strategies: Trading the Breakout and Trading the Reversal.
Explanation of Breakout Strategy: Trading the Breakout involves positioning oneself for a potential price surge in the direction of the breakout, whether it's upward for a falling wedge or downward for a rising wedge. This strategy hinges on the premise that the narrowing wedge indicates impending volatility and a potential trend continuation or reversal.
Entry and Exit Points: Traders typically enter positions when the price decisively breaches one of the trendlines, signaling a breakout. Confirmation is essential, so waiting for a candlestick close beyond the trendline can help filter false signals. For exit points, traders may use technical indicators or set profit targets based on the height of the wedge.
Risk Management: Prudent risk management is crucial when trading breakouts. Traders should set stop-loss orders to limit potential losses and size their positions in accordance with their risk tolerance.
Explanation of Reversal Strategy: Trading the Reversal involves anticipating a change in the current price trend. For instance, in the case of a falling wedge, traders anticipate a bullish reversal. This strategy assumes that as the wedge narrows, selling pressure wanes, paving the way for a potential upward breakout.
Entry and Exit Points: Traders may enter positions as the price breaches the upper trendline, signaling a potential reversal. Confirmation is key, so waiting for a candlestick close beyond the trendline can provide added assurance. Exit strategies may involve setting profit targets or using technical indicators to identify potential reversal points.
Risk Management: Effective risk management is paramount when trading reversals. Stop-loss orders and position sizing should be carefully considered to manage risk.
Tips for trading wedge chart patterns
Wedge Chart Patterns can be potent tools for forex traders, but their effectiveness relies on a combination of skill and sound strategies. Here are some essential tips to consider when trading with these patterns:
Effective risk management should always be at the forefront of a trader's mind. Determine your risk tolerance and set appropriate stop-loss orders. Remember that not all wedge patterns result in successful trades, so it's vital to limit potential losses.
While Wedge Chart Patterns offer valuable insights, it's wise to complement your analysis with technical indicators like Moving Averages, Relative Strength Index (RSI), or Stochastic Oscillator. These indicators can provide additional confirmation of potential breakout or reversal signals.
The forex market is highly influenced by economic events and news releases. Keep a close eye on economic calendars and news updates, as unexpected events can lead to volatile price movements that may impact your wedge pattern trades.
Overtrading can erode profits and increase losses. Stick to your trading plan, and avoid the temptation to trade every wedge pattern you spot. Maintain discipline by adhering to your entry and exit rules, and resist impulsive decisions based on emotions.
Advanced strategies for wedge chart patterns
Beyond the standard rising and falling wedges, advanced traders may encounter variations like double wedges and triple wedges. These formations involve multiple instances of wedge patterns within a single chart, signaling complex price dynamics. Understanding these variations allows traders to spot more intricate opportunities in the market.
Fibonacci retracement and extension levels can be powerful tools when trading wedge patterns. By incorporating Fibonacci ratios, traders can identify key support and resistance levels within the pattern. This added layer of analysis enhances the precision of entry and exit points, increasing the likelihood of profitable trades.
Experienced traders often combine wedge patterns with other technical analysis tools like support and resistance zones, trendlines, and oscillators. This synergistic approach provides a comprehensive view of market conditions, allowing for more confident trading decisions. Utilizing multiple tools can reinforce pattern identification and confirmation.
Case study: trading the falling wedge pattern
Scenario:
In this case study, we'll focus on a falling wedge pattern, which is typically considered a bullish reversal pattern. Let's assume you are a forex trader and have identified a falling wedge pattern on the daily chart of the EUR/USD currency pair.
Strategy:
Pattern Recognition: You notice the formation of a falling wedge pattern on the chart. The upper resistance trendline is sloping downward, while the lower support trendline is steeper but also descending. This pattern suggests a potential bullish reversal.
Confirmation with volume: You observe a decrease in trading volume as the price moves within the wedge, confirming the reduced selling pressure. This volume contraction adds weight to the bullish bias.
Entry and stop-loss placement: To enter the trade, you wait for a breakout above the upper trendline, indicating a potential bullish reversal. You place a buy order slightly above the breakout point to ensure confirmation. For risk management, you set a stop-loss order just below the lower trendline to limit potential losses in case the pattern doesn't play out as anticipated.
Take profit and risk-reward ratio: To determine your take-profit level, you measure the height of the wedge pattern from the highest point to the lowest point and project it upward from the breakout point. This gives you a potential target. Ensure that your risk-reward ratio is favorable, with the potential reward being greater than the risk.
Outcome:
As the market unfolds, the price indeed breaks out above the upper trendline, confirming the bullish reversal. Your trade is triggered, and you stay disciplined with your risk management. The price subsequently continues to rise, reaching your take-profit level. Your trade results in a profitable outcome.
Conclusion
Wedge Chart Patterns hold a special place in the toolbox of forex traders. They offer a means to navigate the complex world of currency markets by providing insights into potential price movements. Whether one is in pursuit of opportunities for trend continuation or reversal, Wedge Chart Patterns can serve as a guiding framework amidst the inherent unpredictability of the financial landscape.
