What are the Best Forex Technical indicators
All Trading platforms have a variety of tools and indicators provided for traders and technical analysts. There are literally thousands of Forex technical indicators available for use on trading platforms (Mt4, Mt5, tradingview) and many others that can be downloaded from the internet.
Those who are new to Forex trading are very excited when they see the hundreds of technical indicators that can be used to perform technical analysis.
The awareness of the numerous trading tools and indicators that can be used for chart analysis is very exciting to beginners and novice traders. Their confusion often stems from the lack of knowledge and understanding of which indicator is most suitable for their trading style, strategy, market conditions, and even how to use the indicator in an efficient and profitable manner.
Everyone has a different personality trait which translates to different trading styles, likewise, everyone has a preference for different indicators. Some prefer indicators that measure historical price movements, others prefer momentum, and yet others, trading volume. Oftentimes, these different types of indicators are used in combination with one another to yield different results.
What Are Technical Indicators?
Technical indicators are chart interpretations (usually in the form of slope lines) that are derived from various mathematical formulas using the data points and figures of price movement.
The data points and figures of price movement include the following:
- The open price
- The high
- The low
- The closing price
- Volume
The mathematical derivations of different indicators read different meanings to price movement thus displaying different types of trade signals drawn over price movement or in a separate window (above or below the price chart).
The majority of technical indicators were developed long before the internet and were actually designed for the stock and commodity markets.
Today, anyone with coding skills can develop his or her own technical indicator by simply writing some lines of code, utilizing so much of the information that he or she understands and can derive from the market.
Indicators view on forex chart
Technical indicators are designed to be either;
- Overlay indicators: These are indicators that are plotted and drawn over price movement. Examples include moving averages, Bollinger Bands, Fibonacci and many more.
- Oscillators: these are indicators that are plotted and displayed in a separate window, usually below or above price movement. Examples include the stochastic oscillator, MACD, or RSI.
Category of indicators
Technical indicators can be classified into four different categories based on the variables of price movement that they measure which may be: trend, momentum, volatility or volume.
Some indicators may have similar characteristics to more than one group. One such indicator is the RSI (Relative Strength Index) which functions as a volatility or momentum indicator. Some analysts also use the MACD (Moving Average Convergence Divergence) indicator to determine the direction and strength of a trend.
We will explore each category of indicators in more detail citing a few examples.
- Trend indicators
Many experienced traders agree that trading in alignment with the trend provides the best chances of profitable trades. In logical terms, you will be more likely to profit by trading alongside an existing trend rather than against it.
However, counter-trend strategies are also effective but only in specific circumstances. Therefore, identifying a trend and trading in that direction increases your odds of profitable outcomes.
A. Moving average convergence and divergence (MACD)
The MACD indicator is designed to reveal changes in the strength, momentum and direction of a trend.
The indicator is represented by the following
- The MACD line - is the difference derived from two exponential moving averages (default 12 and 26-period EMA).
- A 9-period EMA of the MACD line - is known as the signal line and is used to generate buy and sell signals.
- The histogram - which plots the distance between the MACD line and the signal line
In most MetaTrader platforms, the MACD is displayed as a histogram and using the 9-period simple moving average (SMA) as the signal line - as shown in the chart below
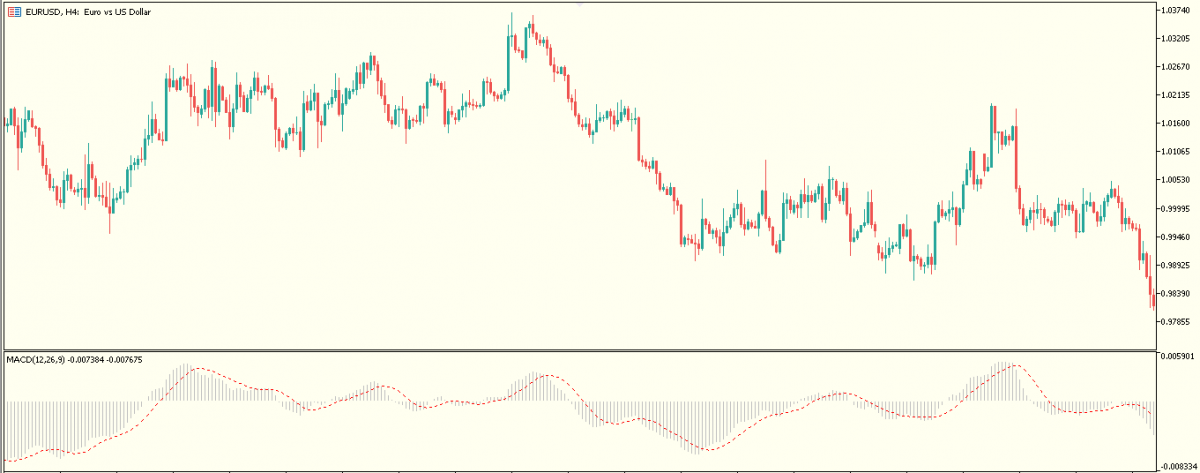
It is often used to identify divergences. This is when the direction of price movement is not supported by the direction of the histogram which may lead to a possible reversal.
B. Average directional movement index (ADX)
ADX Indicator is a lagging Forex technical indicator that combines two directional indicators '+DI and -DI' to indicate the strength of a trend.
These directional indicators estimate the relationship between the current day's highs and lows, and the closing price of the previous day.
By comparison, the +DI gauges the strength of the current day bulls, against yesterday's, likewise the -DI measures the strength of the previous day bears. Using the ADX, we can see which side (bullish or bearish) is stronger today, compared to yesterday
The indicator is represented by three lines;
- The ADX itself (solid green line),
- The +DI (dotted blue line)
- The -DI (dotted red line),
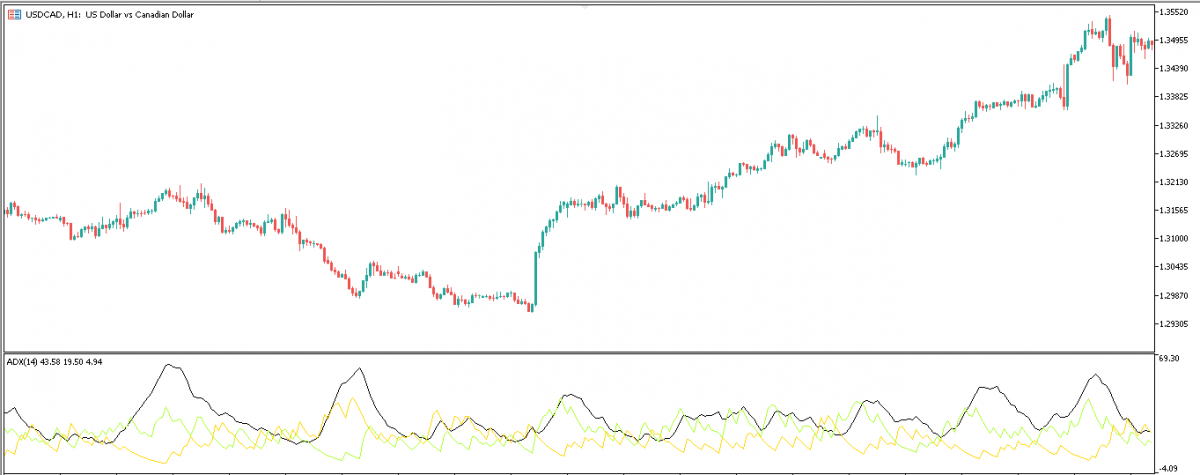
They all are measured on a scale of 0 to 100. The ADX line below 20, suggests that the trend (whether bullish or bearish) is weak. On a scale of 40, it means a trend is underway, and above 50 suggests a strong trend.
- Momentum indicators
Momentum indicators, also referred to as oscillators, can help you pinpoint overbought and oversold conditions.
They illustrate the velocity and the magnitude of price movements. Together with trend indicators, they can help to identify the beginning and the climax of a trend.
A. Relative strength index (RSI)
The RSI helps to gauge momentum and trend strength by plotting recent price highs versus recent price lows and showing the relative strength of price movement on a scale of 0 to 100. Thus revealing overbought and oversold conditions in price movements.
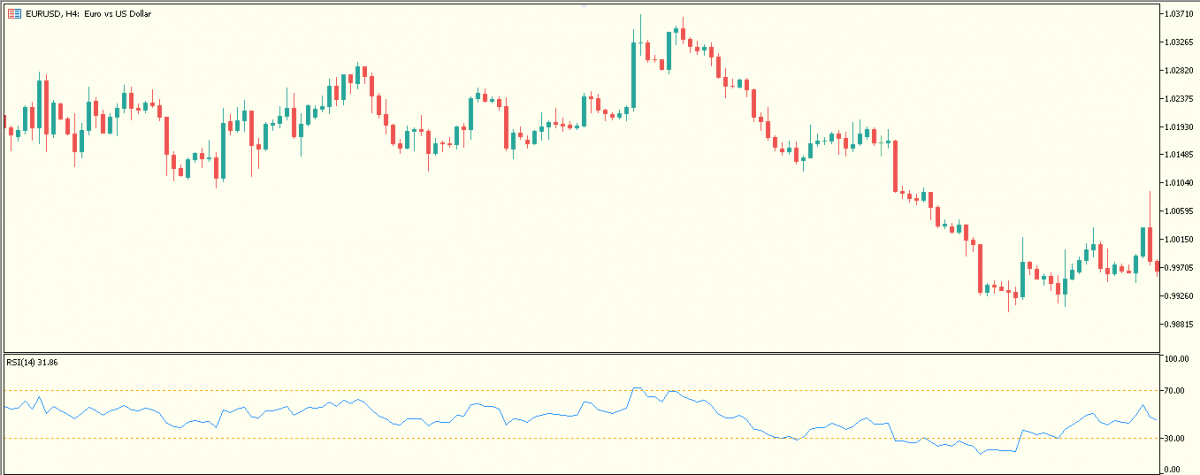
In the event that the RSI moves above 70, price movement may begin to decline, since it is considered overbought. Conversely, below the 30 RSI level, price movement may begin to rally because the market is considered to be oversold.
These assumptions are not 100% guaranteed; therefore, traders might need to wait for more confirmations from other indicators or chart patterns before opening a market order.
B. Stochastic Oscillator
The stochastic oscillator is an indicator that measures the current price movement relative to a price range for a certain period of time. Basically, the stochastic keeps track of price movement highs and lows.
When price moves to a bullish extreme, the stochastic gets close to the 100 level and when price moves to a bearish extreme, the stochastic gets close to the zero level.
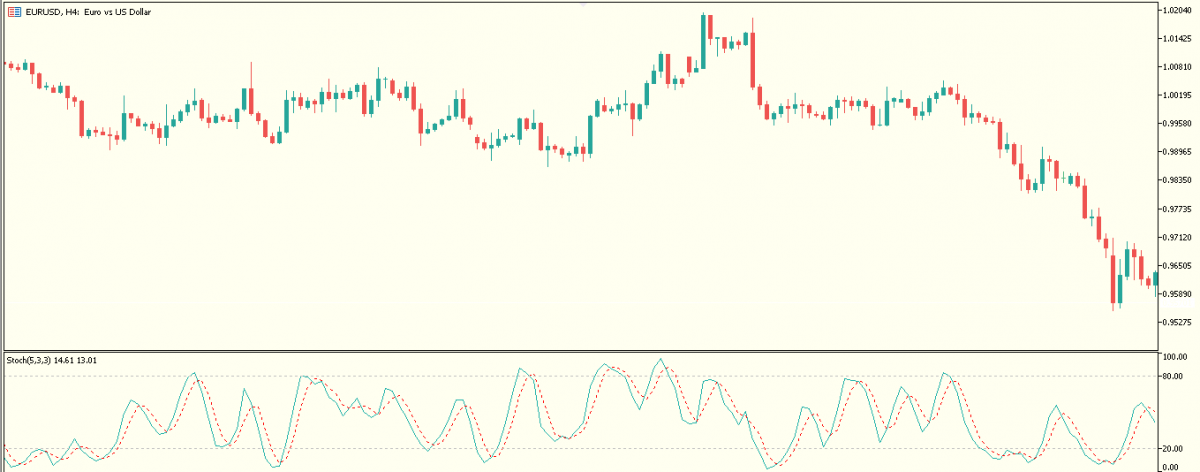
When the stochastics exceeds the 80 levels, it is considered overbought, and below the 20 levels, it is considered oversold.
- Volatility
Volatility is a way of quantifying price variability by measuring the rate of change in the direction of price movement and comparing them to historical values.
To better understand the chaos appearing on forex charts, it is helpful to use popular volatility indicators.
A. Average True Range (ATR)
The Average True Range indicator measures the volatility of the market by taking into account the current high and low and the previous session's closing price. The ‘true range’ is then defined as the greatest of either of the following:
- The difference between the current high and the current low, or
- The difference between the previous close and the current high, or
- The difference between the previous close and the current low.
The ATR is then displayed as a moving average, with a default value of 14 periods. The volatility and the ATR of the forex market are directly proportional, i.e. higher volatility implies higher ATR and vice versa.
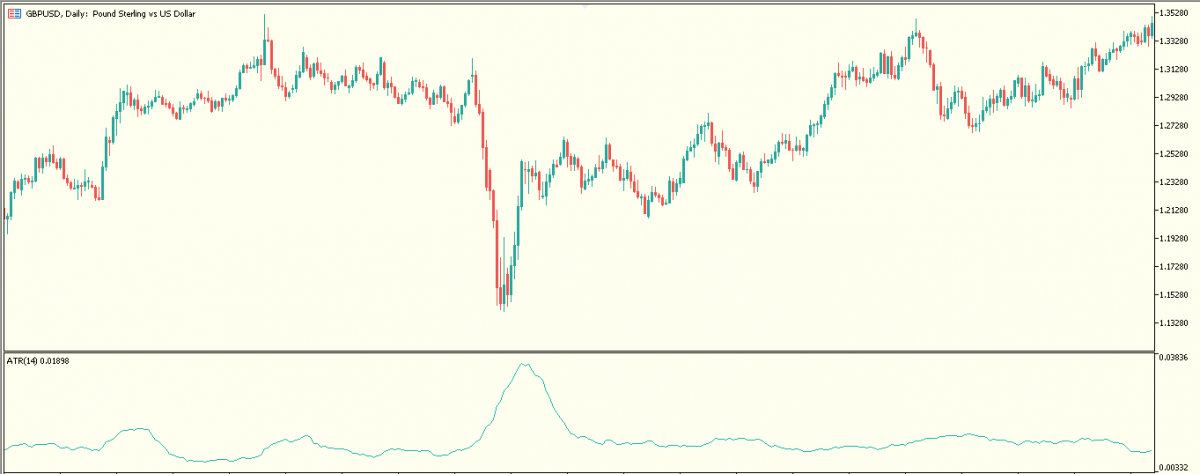
The ATR, although of limited use, is very useful for predicting the extent of price expansions and for making long-term trading decisions.
B. Bollinger Bands
Another highly effective volatility indicator is in the form of a band consisting of three lines.
An SMA (with a default value of 20) is enveloped by two additional lines:
- The lower band = SMA minus two standard deviations
- The upper band = SMA plus two standard deviations
The result is a sloppy and dynamic support and resistance boundary that widens and contracts around price movement. The default values of the band can be adjusted according to the preferences of the trader.
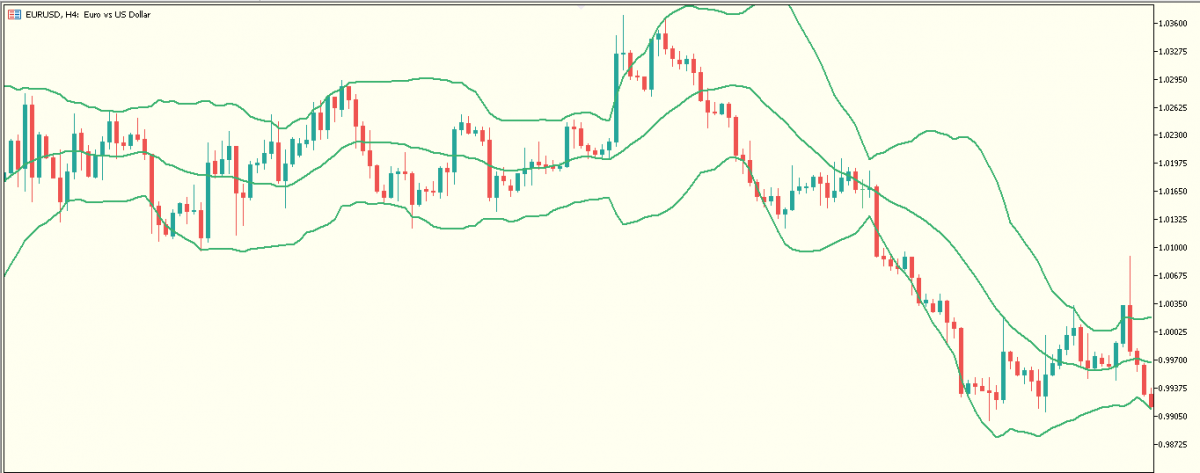
When price movement is near the upper line of the band, the market is considered overbought and when the price movement is at the lower line of the band, the market is considered oversold.
- Volume Indicators
Volume indicators show the volume of trades behind a price movement. If there is a massive one-sided order (buy or sell) on a certain financial instrument, there must be some major driving force or news release behind such a volume of market order.
In contrast to stocks, commodities, or even Forex futures, the forex market is traded over-the-counter (OTC) which means there is no single clearing location so the calculation of volumes is quite impossible.
That is to say that the volume available on the retail forex broker's platform does not report the total volume worldwide, nonetheless, many traders still make good use of volume indicators.
A. The on-Balance volume (OBV)
The OBV Indicator is used to measure the increase or decrease in the flow of volume of a financial asset relative to its price movement. Based on the idea that volume precedes price, volume can therefore be used as a confirmation of the magnitude of price movements.
How is the OBV calculated?
In comparison with the previous day, when there's an increase in daily volume, a positive number is assigned to the OBV. Similarly, a decline in the trading volume compared to the previous day's volume gets the OBV assigned a negative value.
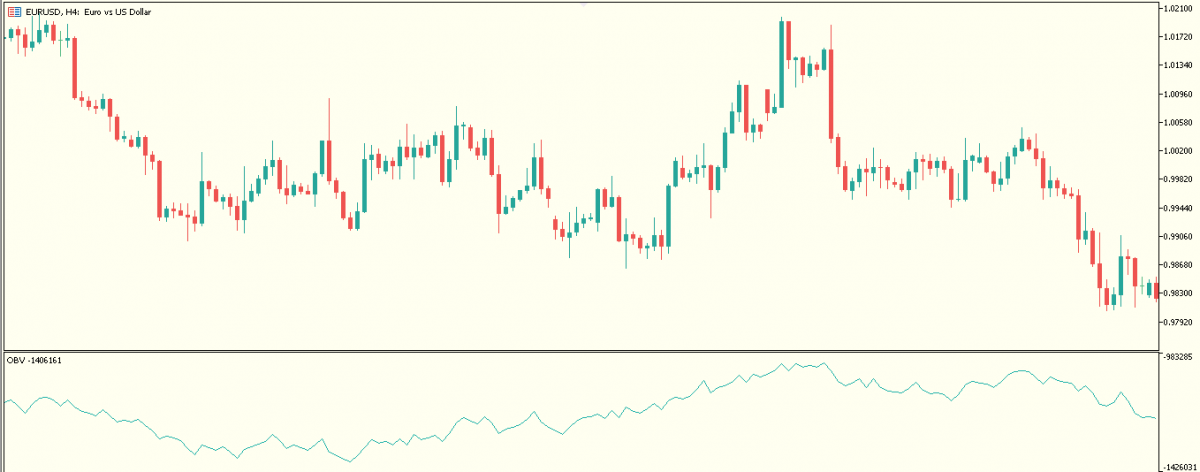
The OBV indicator moves in accordance with price movement, but if there is a divergence between price movement and the OBV, it would indicate weakness of the price move.
Summary
Here, we have looked at the best indicators employed by most technical analysts. It is best to use a suite of technical tools and indicators in combination with other techniques like fundamental analysis to enhance your understanding of price movement and improve the quality of your trade setups which can also be incorporated into automated trading systems.
Click on the button below to Download our "What are the Best Forex Technical indicators" Guide in PDF
