What are the most commonly used chart patterns in Forex Trading
In order to gain understanding of the price movement of forex pairs, stocks and other financial assets, careful studies must be carried out on the historical price movements and recurring patterns that can be seen on price charts. Forex price chart is the tool that every forex trader and analyst uses to study the price movement of forex pairs. They are visually represented by three different types of chart and can be set to a specific period of time which could be monthly, weekly, daily, hourly and even seconds.
What are the 3 different types of forex charts
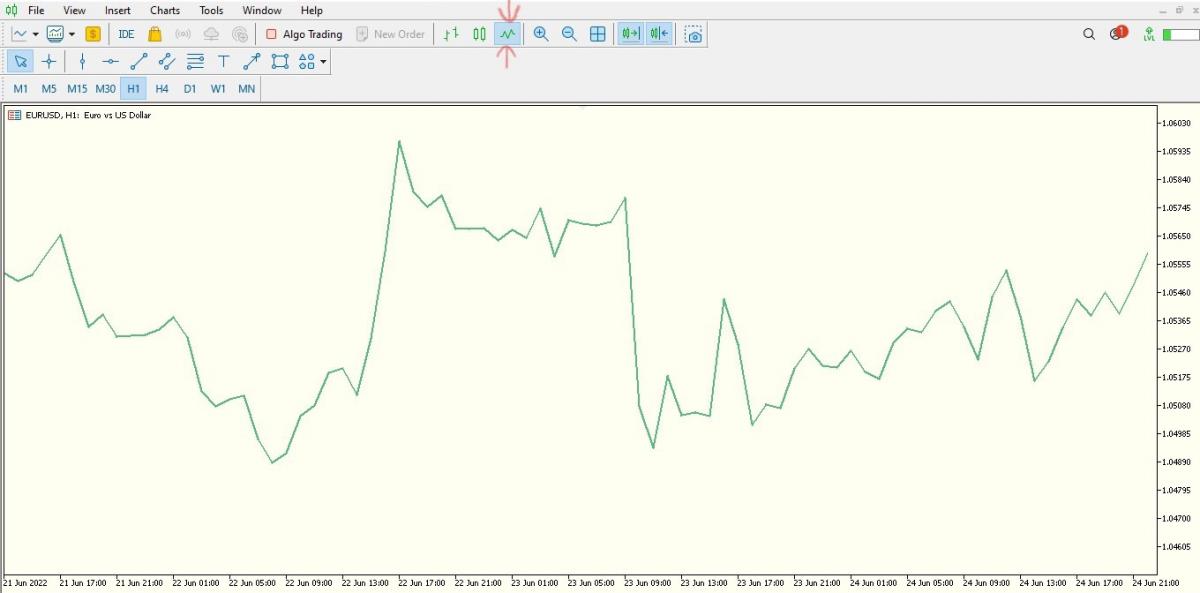
- Line chart: This type of chart is useful to get the “big picture” overview of price movements usually by the closing price of every ending period of a certain timeframe thus making it easier to track trends and compare closing prices from one period to the next.
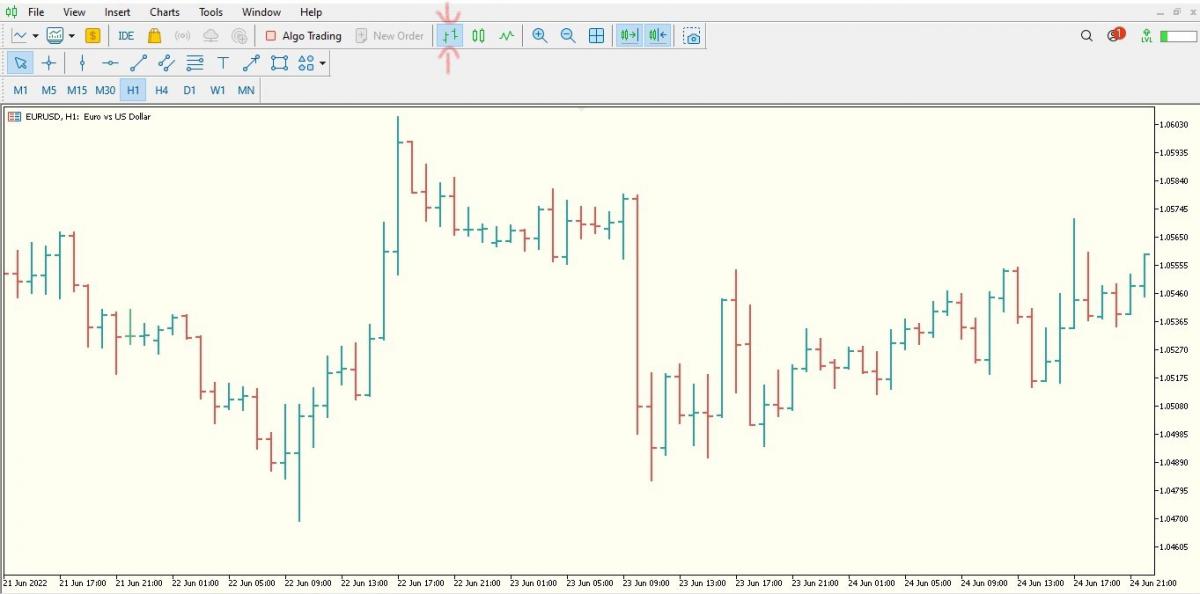
- Bar Chart: Bar chart reveals much more detail about price movement. It provides more information about the price ranges of each trading period by highlighting the opening and closing prices, as well as the highs and the lows of each trading period - on bars of varying sizes.
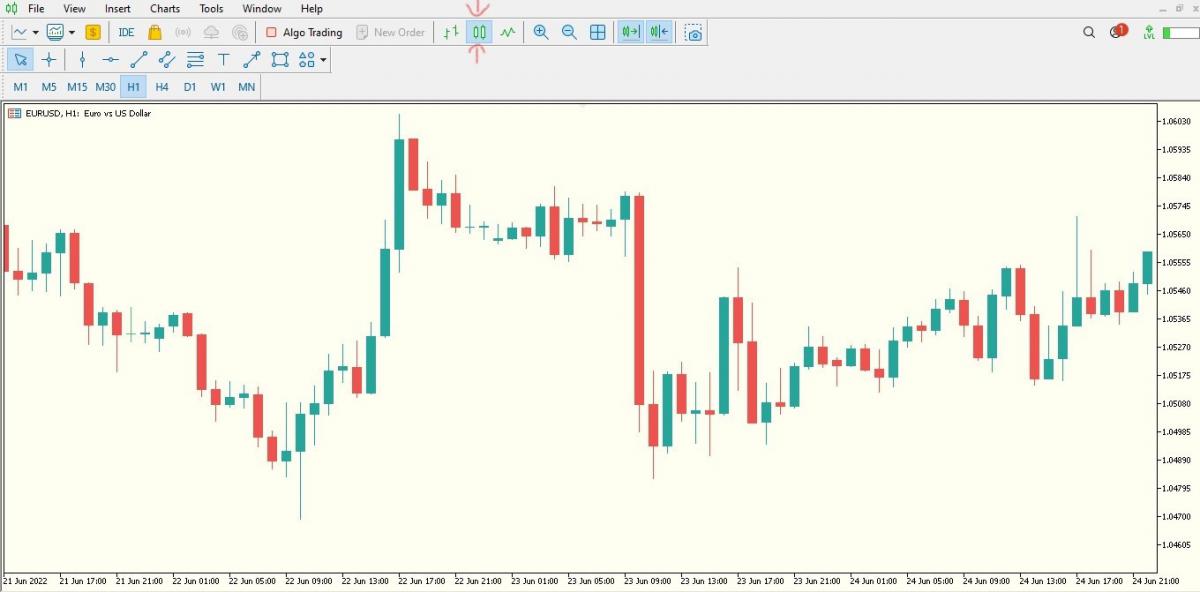
- Candlestick chart: The candlestick chart is a more graphical variation of the bar chart that shows the same price information but in a candle-like format. With two different colors to visualize bullish and bearish sentiments.
There's a handful of insightful information that can be gleaned from the price movement of currencies and other financial assets on different types of price charts.
We will be discussing one of the most significant aspects of price movement known as 'chart patterns’.
Chart patterns are of different kinds. They play a very important role and form the basis of various trading strategies. Beginners and professionals use chart patterns to uncover market trends and predict future directions of price movements. In addition to forex pairs, they can also be used to analyse stocks, commodities and other financial instruments.
Categories of chart patterns
In this section, we will categorise chart patterns according to the role they play in identifying the sentiment of certain recurring patterns in price movement.
- Reversal Chart Patterns
These are typical patterns of price movement that reveal an imminent reversal or change in the direction of a current trend. They may form at the top of an uptrend or at the bottom of a downtrend thus suggesting a climax and possible change in the direction of price movement.
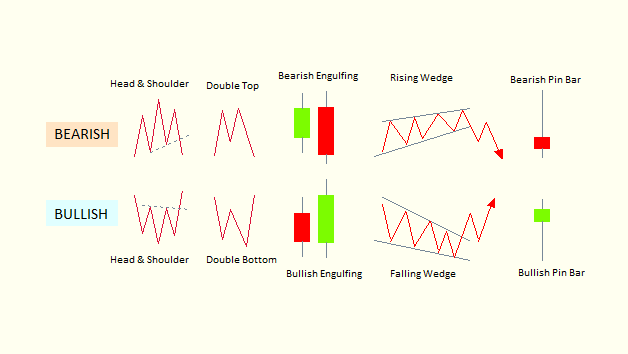
In this context, here are some highly probable chart patterns that can signal the imminent reversal of a trend.
- Double top & double bottom
- Head and Shoulders
- Rising & falling wedge
- Engulfing Candle
- Pin bars
When trading these chart patterns, it is important to set a profit target that is as high as the pattern formation. For instance, if you see a 'head and shoulder' formation at the bottom of a downtrend, place a long order at the top of its neckline and aim for a profit target that is just as high as the height of the pattern.
- Continuation Chart Patterns
Trends don’t usually move smoothly without encountering some resistance that may cause a short-term pause (sideway price movement) or short-term pullback before resuming in the direction of the trend. There are patterns that indicate when a prior trend is likely to resume and regain momentum.
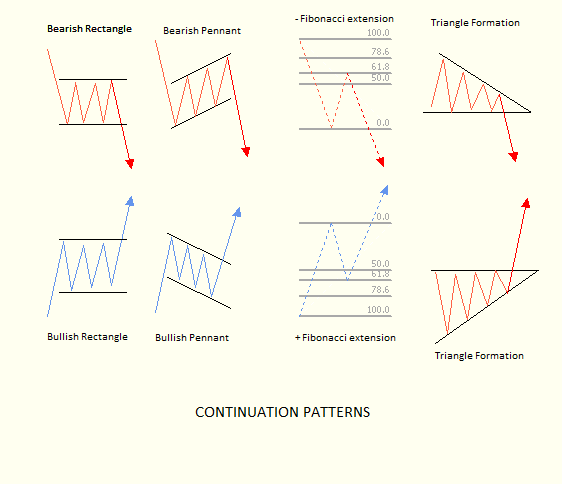
Among the most commonly known continuation patterns are flags, pennants, and the Fibonacci 61.2% optimal entry. This category of chart patterns is the best and most profitable because the preceding price expansions are in alignment with the trend and thus, very profitable.
- Bilateral chart patterns
The term 'bilateral' simply means either way or direction. An example of this chart pattern is the 'triangle' formation - where price movement could break either to the upside or downside of the triangle. This category of chart patterns should be traded with the consideration of both scenarios (upside breakout or downside breakout).
Having such a variety of chart patterns for trading, it is important to know the most common, most recurring and most profitable of all these chart patterns and then with a simple approach, a full-fledged trading plan can be developed around these chart patterns.
Here, we'll provide you with a set of instructions to trade the most common Forex chart patterns.
Most common forex chart pattern
The following forex chart patterns are the most common and apparent chart patterns that can be seen on any timeframe and on the chart of any financial assets.
1. The head and shoulders forex pattern
This is a very unique chart pattern that is formed by three peak highs at the top of price movement or three peak lows at the bottom of price movement, with the second peak in the middle usually the biggest.
What is the formation of this three peak pattern (head and shoulders) above or below price movement?
Firstly, from the left, price movement makes a peak (1st shoulder) and then another peak (the head) usually larger than the first and the third peak (2nd shoulder). After the pattern has formed, the neckline must be broken through before considering a long or short market order depending on the location and direction of the pattern. In addition, the profit objective may be as high as the head of the pattern.
The pattern makes a good trading plan with precise levels of entry, stop loss and take profit.
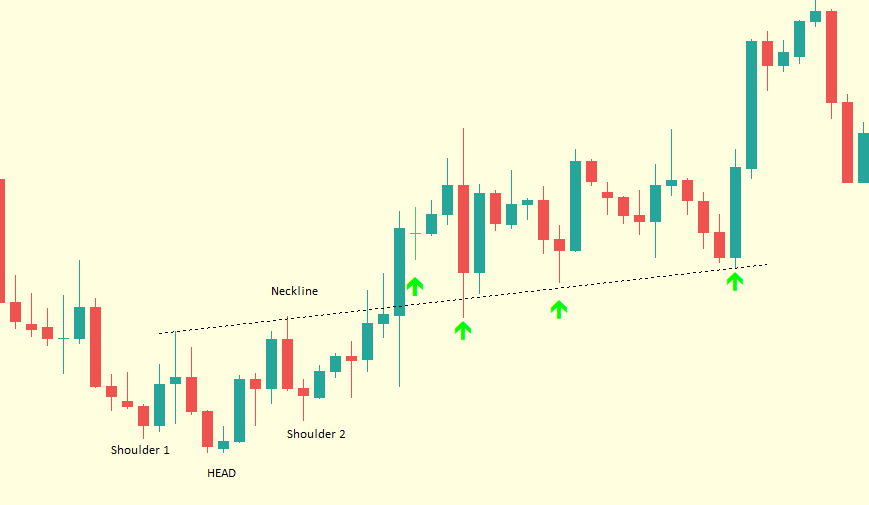
Example of a bullish head and shoulder formation at the bottom of price movement
2. The Triangle Forex Chart Patterns
Triangle Forex patterns can be identified by two trendlines: a horizontal and a slanted trendline (ascending or descending) with the price movement bouncing within the defined perimeters of the trendline before eventually breaking out.
Forex triangle patterns can be classified into three different types based on the shape of their formation and the future directions of price breakout. They are as follows
- Symmetrical triangles
- Ascending triangles
iii. Descending triangles
Symmetrical triangles
This triangle pattern, often considered a bilateral chart pattern, is formed by a period of price movement in a converging consolidation. The pattern can be identified by a descending trendline and an ascending trendline converging at a point, commonly referred to as the apex. Within the two trendlines, price movement will bounce towards the apex, and then, a typical breakout will occur in either direction of the prior trend.
In the case of being preceded by a downward trend, a trader's task is to anticipate and act upon the breakout below the ascending line of support. However, if the pattern is preceded by an upward trend, the trader should anticipate and act upon the breakout above the descending line of resistance.
It is also important to note that whilst this pattern favours the continuity of a trend, price movement might often break out in an opposite direction and reverse the trend. An example is given below.
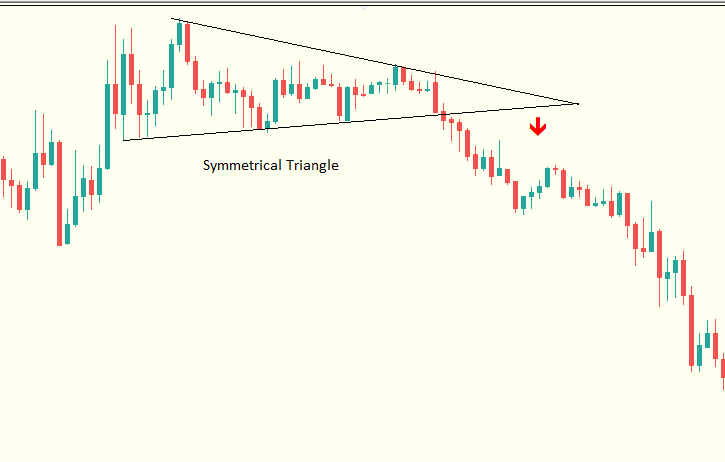
Bilateral case study of a symmetrical triangle
The Ascending Triangle
The ascending triangle is a bullish Forex pattern that is formed by the assumption of two trendlines over price movement. A horizontal trendline acts as resistance and an ascending trendline provides support to price movement.
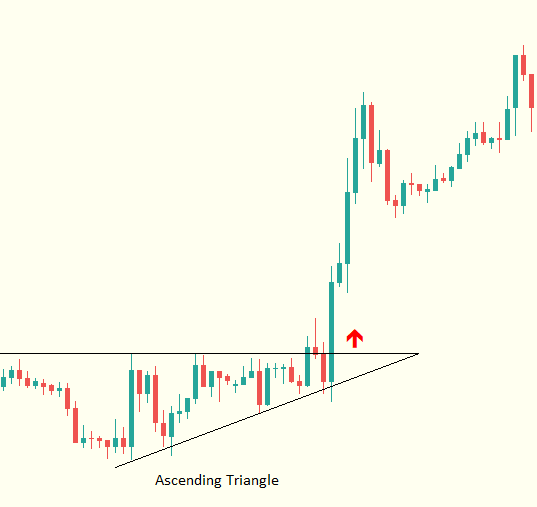
In this scenario, the price movement of a financial asset bounces and converges within the perimeters of this triangle until an upward breakout occurs above the resistant horizontal line. The surge of price movement after the bullish breakout is usually very explosive, making it a highly probable and profitable chart pattern.
The Descending Triangle
This is the opposite of the ascending triangle chart pattern. The descending triangle is formed by the assumption of two lines over price movement. A horizontal trendline acts as support and a descending trendline provides dynamic resistance to price movement.
Like the ascending triangle, price movement bounces within the perimeters of the triangle and converges towards the apex but a descending triangle chart pattern will see a downward breakout below the supportive horizontal line.
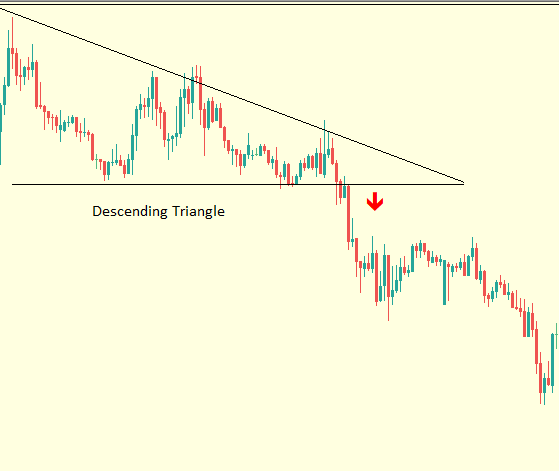
As with all triangle patterns, the price will not always break out in the expected direction as this is not an exact science. It is therefore essential to implement a good risk management plan in order to minimize the impact of unexpected outcomes.
3. The Engulfing Candle Forex Chart Patterns
When analysing price movement, a lot more information can be derived from the candlesticks of a price chart. For this reason, candlesticks are a useful tool for determining the future of price movement in all time frames.
There are lots of candlestick chart patterns therefore it is good to pay attention to the best, the most highly probable and easiest to spot which is the engulfing candlestick.
This pattern does present an excellent trading opportunity that is highly precise of a certain direction in price movement either a reversal or the beginning of a new trend
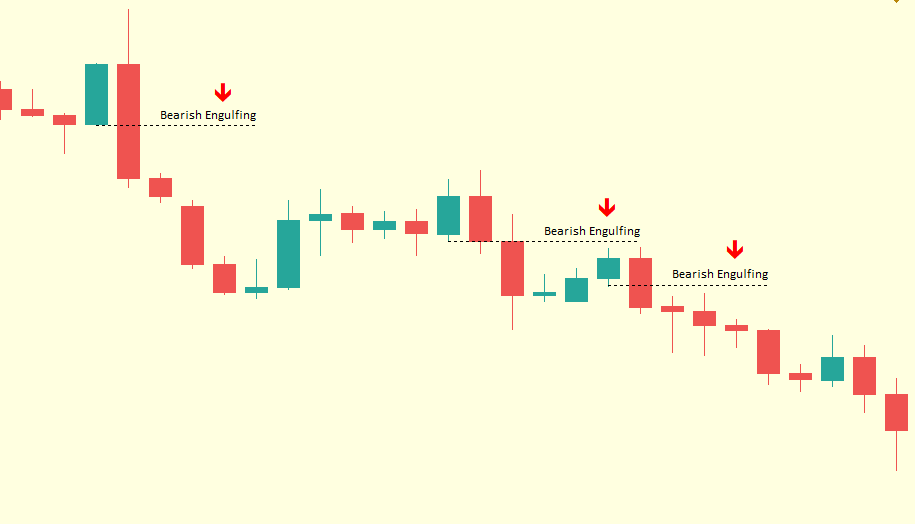
How to spot engulfing candlesticks chart patterns
When price movement is expected to reverse from a bearish trend or begin a bullish trend. A prior down candle will get entirely engulfed by the body of a bullish candle thus forming a bullish engulfing candlestick pattern. A long market order can be opened on this pattern with the stop loss placed a few pips right below the body of the bullish engulfing candlestick pattern.
Conversely, when price movement is expected to reverse from a bullish trend or begin a bearish trend. A prior 'up candlestick' gets entirely engulfed by the body of a bearish candlestick thus forming a bearish engulfing candlestick pattern. A short market order can be opened on this pattern with the stop loss placed a few pips right above the body of the bearish engulfing candlestick pattern.
A savvy trader may use all these well-known chart patterns to construct their own distinctive trading strategy.
Click on the button below to Download our "What are the most commonly used chart patterns in Forex Trading" Guide in PDF
