What is divergence in Forex
Divergence in Forex refers to a pivotal concept that plays a crucial role in technical analysis, aiding traders in making informed decisions about their positions. Understanding divergence is fundamental for traders aiming to navigate the complexities of the Forex market successfully. Divergence can provide traders with early warnings about potential trend reversals, allowing them to adjust their strategies accordingly. By recognizing divergence patterns, traders can enhance their ability to make well-timed entries and exits, thus managing risk more effectively.
Understanding divergence in forex
Divergence in Forex is a fundamental concept that traders rely upon to decipher potential shifts in market sentiment and price direction. At its core, divergence signifies a discrepancy between the price of a currency pair and the behavior of a technical indicator. This phenomenon arises when the price is moving in one direction, while the indicator is moving in the opposite direction. Understanding this concept is pivotal for traders as it can offer critical insights into the market's underlying dynamics.
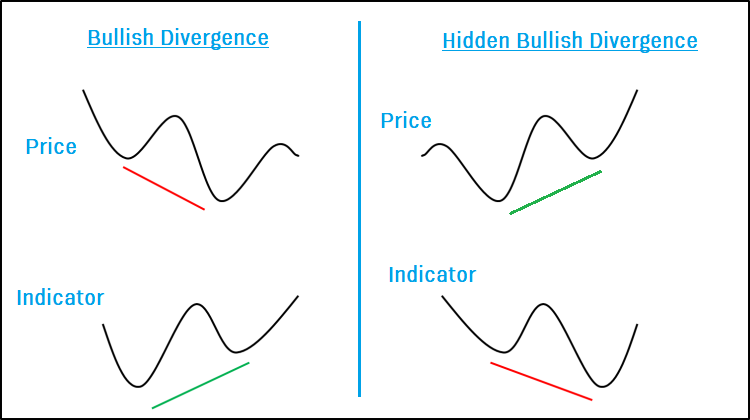
Divergence can be classified into two primary categories: regular and hidden divergence. Regular divergence typically occurs when the price and indicator move in opposite directions, signaling a potential reversal in the current trend. On the other hand, hidden divergence implies that the price and indicator move in the same direction, suggesting a continuation of the existing trend. These divergence patterns can manifest on various timeframes, providing traders with a versatile tool for analysis.
Divergence holds great significance in Forex trading due to its ability to serve as an early warning system for potential trend reversals or trend continuations. By recognizing divergence patterns, traders gain a deeper understanding of market dynamics, which can aid in making more informed decisions. This analytical tool empowers traders to identify potential entry and exit points, manage risk effectively, and enhance the overall precision of their trading strategies.
Identifying divergence
Technical indicators are essential tools in Forex trading that provide traders with valuable insights into market trends, momentum, and potential reversals. These indicators are mathematical calculations based on price, volume, or open interest data. In the context of divergence, technical indicators are instrumental in identifying discrepancies between price movements and indicator readings.
List of technical indicators
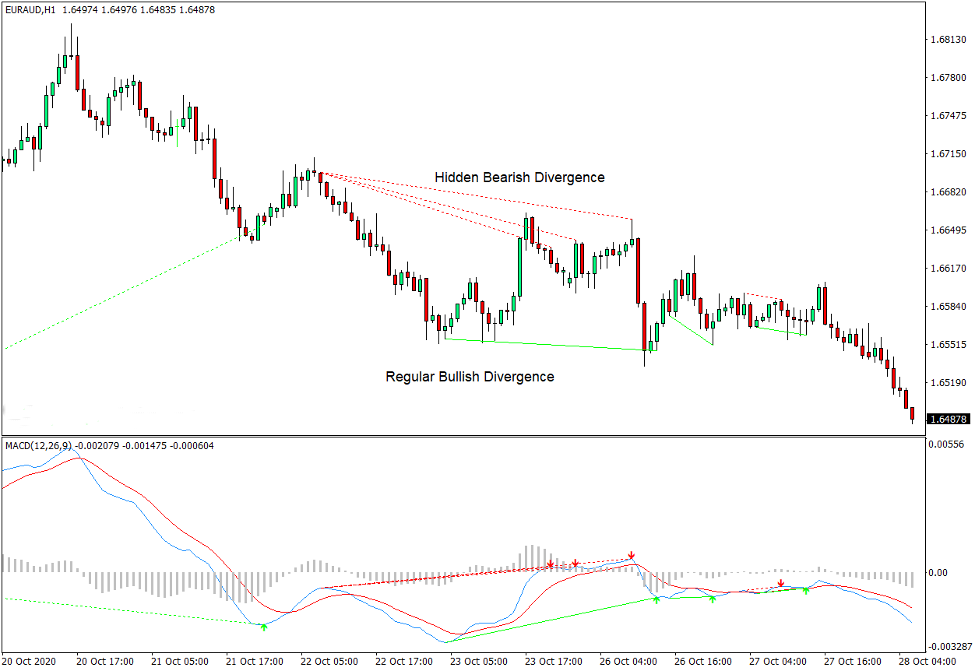
Moving Average Convergence Divergence (MACD): The MACD is a versatile indicator that helps traders identify shifts in momentum. It consists of two lines – the MACD line and the signal line – and can signal both regular and hidden divergence.
Relative Strength Index (RSI): RSI measures the speed and change of price movements. It is widely used to detect overbought or oversold conditions and can highlight regular divergence patterns.
Stochastic Oscillator: The Stochastic Oscillator helps assess the closing price relative to a price range over a specific period. It is a popular choice for identifying overbought and oversold conditions and spotting divergence.
Commodity Channel Index (CCI): CCI quantifies the variation of a currency pair's price from its statistical mean. Traders use it to identify potential trend reversals and divergence.
Momentum indicator: Momentum indicators, like the Rate of Change (ROC) or the Relative Vigor Index (RVI), focus on price changes over time and can help traders identify divergence as well.
Each of these technical indicators contributes to spotting divergence in unique ways. They provide traders with divergent signals by comparing price movements with their own calculations, offering crucial insights into potential trend reversals or continuations.
Chart patterns and divergence
Triangle Patterns: Triangle patterns, such as ascending triangles, descending triangles, and symmetrical triangles, can provide divergence signals when combined with technical indicators. Breakouts from these patterns can indicate potential trend changes.
Head and Shoulders Patterns: This classic chart pattern, along with its inverse, can offer divergence signals when the neckline is breached. It signifies a shift in market sentiment.
Double Top/Double Bottom Patterns: Double top and double bottom patterns can accompany divergence signals, hinting at potential price reversals after a second unsuccessful attempt to break a key level.
Bullish divergence trading strategy
Entry and exit points:
When employing a bullish divergence trading strategy, traders look for instances where the price of a currency pair forms lower lows while the corresponding technical indicator, such as the RSI or MACD, forms higher lows. This divergence signals a potential reversal of the downtrend and a shift towards an uptrend. Traders may enter long positions when this divergence is confirmed and place stop-loss orders below recent swing lows to manage risk.
To exit a bullish divergence trade, traders often look for signs of weakening momentum, such as overbought conditions on the indicator or the formation of a bearish divergence. Additionally, setting a target based on support and resistance levels or using a trailing stop can help secure profits.
Risk management:
Risk management is vital in any trading strategy. When trading bullish divergence, it's essential to set a stop-loss order to limit potential losses in case the trade goes against you. Proper position sizing and risk-reward ratio assessment are crucial components of risk management.
Examples:
To illustrate the bullish divergence trading strategy, suppose a currency pair has been in a prolonged downtrend, with lower lows and lower highs on the price chart. Simultaneously, the RSI indicator shows higher lows. This divergence could be seen as a signal to enter a long position, with a stop-loss below the recent swing low. If the divergence is confirmed and the price starts to rise, traders might consider taking profits as the trend strengthens.
Bearish divergence trading strategy
Entry and exit points:
In a bearish divergence trading strategy, traders seek situations where the price forms higher highs while the corresponding indicator forms lower highs, signaling a potential reversal from an uptrend to a downtrend. Traders may enter short positions when this bearish divergence is confirmed, placing stop-loss orders above recent swing highs to manage risk.
To exit a bearish divergence trade, traders watch for signs of weakening downside momentum, such as oversold conditions on the indicator or the formation of a bullish divergence. Setting profit targets based on support and resistance levels or using a trailing stop can help secure gains.
Risk management:
Risk management remains critical when trading bearish divergence. Employing a stop-loss order is essential to limit potential losses if the trade does not go as anticipated. Sound position sizing and risk-reward analysis are fundamental aspects of risk management.
Examples:
To provide a practical example of the bearish divergence trading strategy, imagine a currency pair experiencing an extended uptrend, marked by higher highs and higher lows on the price chart. Simultaneously, the RSI indicator displays lower highs. This bearish divergence might signal an opportunity to enter a short position, with a stop-loss above the recent swing high. If the divergence is confirmed and the price starts to decline, traders may consider taking profits as the downtrend strengthens.
Practical tips and considerations
When dealing with divergence signals, it's crucial to emphasize the significance of confirmation. Divergence alone is a valuable indicator, but it becomes more potent when supported by additional evidence. Traders often use confirmation tools such as trendline analysis, support and resistance levels, or candlestick patterns to strengthen their divergence-based trading decisions. Confirming divergence can help reduce false signals and enhance the accuracy of your trades.
Divergence should not be viewed in isolation but as part of a comprehensive trading strategy. While divergence signals can provide valuable insights, they should be considered alongside other technical indicators and market analysis techniques. Combining divergence signals with other forms of analysis, such as trend analysis or volume analysis, can offer a more holistic view of the market and improve the overall quality of trading decisions.
Traders should be aware of common pitfalls when using divergence as part of their trading strategy. These include overtrading, where traders act on every divergence signal without considering other factors, and ignoring the broader market context. Additionally, it's essential to stay disciplined and not let emotions guide your trading decisions. Having a well-defined trading plan that includes clear entry and exit rules, risk management strategies, and position sizing can help avoid common trading mistakes.
Conclusion
Divergence is a versatile and powerful tool that should not be overlooked by Forex traders. It offers a unique perspective on market dynamics and can significantly enhance decision-making. Integrate divergence into your trading strategy to gain an edge in Forex. Divergence can provide you with early signals, helping you seize opportunities and manage risks more prudently.
As with any trading strategy, mastering divergence in Forex requires practice, patience, and continuous learning. It is important to allocate sufficient time to apply what you have learned in a controlled and disciplined manner. Keep a trading journal to document your divergence-based trades, successes, and mistakes. By doing so, you can refine your skills over time and adapt your approach to changing market conditions. Remember that experience is your best teacher in the world of Forex trading, and each trade provides an opportunity to grow as a trader.
