What is MACD strategy
The word “MACD” is the acronym for an oscillator-type indicator known as Moving Average Convergence Divergence. It was invented by Gerald Appel in 1979 and ever since it is one of the most potent technical indicators used by traders to identify price momentum and trend opportunities across financial markets.
To effectively trade the MACD strategies profitably, traders must understand the MACD indicator, how it works and have a practical guide on how to make good use of the MACD indicator for various trading decisions.
BRIEF OVERVIEW OF THE MACD INDICATOR
The name ‘Moving Average’ ‘Convergence’ ‘Divergence’ tells a lot about the indicator. It portrays an idea of two moving averages used to derive a convergence and divergence technical reading of price movement which is actually true!
The technical reading tells a lot about the strength of price movement, the direction of a trend as well as reversal conditions of the market.
The technical analytics of the MACD indicator is a very useful resource for indicator-based traders, so therefore it is imperative that the components, settings, operations, and other factors that have an effect on the MACD indicator be properly understood for effective application of the tool and profitable trading result.
WHAT ARE THE TECHNICAL COMPONENTS OF THE MACD INDICATOR
The technical components of the MACD indicator are comprised of
1- A pair of line, one is called “MACD line” and the other “Signal line”.
2- A histogram.
3- A zero line reference point.
These are all derivatives of the indicator input parameters which consist of two exponential moving averages (EMA) and a simple moving average (SMA) with a default value of 12, 26, 9. These values can be modified to fit a desired trading plan or strategy.
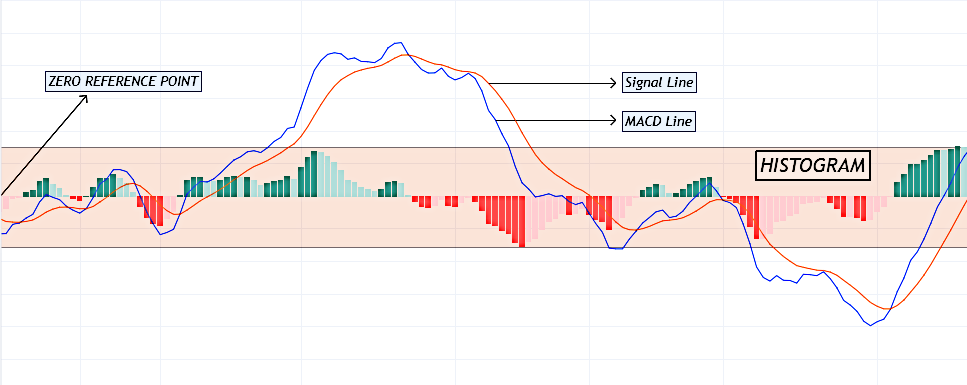
Image 1: Sample view of the MACD indicator showing its components
The “MACD Line” is the blue coloured smoothed line which is a derivative of the difference between the two EMA parameters of the indicator (EMA 12 and EMA 26).
The “Signal line” (red colour) is a 9-period simple moving average of the “MACD line” i.e it is a calculated average of an average.
They (MACD and Signal line) are plotted in pair to interpret price movement by their distance apart and crossovers.
The MACD histogram in the form of an oscillator is a graphical representation of the distance apart between the MACD Line and Signal Line.
The zero line reference point is just a reference point to read the dominant market direction and filter both the crossover and the histogram signals.
HOW DO WE INTERPRET ALL THE TECHNICAL COMPONENTS OF THE MACD INDICATOR AS THEY RELATE TO PRICE MOVEMENT.
Of Course, the derived technical readings of the indicator are in harmony with each other but they mean quite different things.
- It is important to understand that the Signal and the MACD line cross is a lagging signal because it is dependent on price movements although it is the most important signal of the indicator.
- Whenever there is a line cross signal above the zero reference point, it indicates a bullish market condition and if the cross signal is below the zero reference point, it means the market is in a bearish condition.
- Furthermore, the greater the distance apart between the line pair, is a sign of strength in price movement towards a particular direction.
- The greater the distance between the line pair (MACD and Signal line) above or below the zero reference line is usually seen with a corresponding increase in distance between the EMAs on the price chart.
- When the 12 period EMA is above the 26 period EMA, the line cross signal is considered positive; otherwise, the crossover is considered to be negative.
- The frequency of line cross signals can be reduced by increasing the input value for the signal line, this will help to avoid a bunch of false signals.
- The histogram always reads positive when the MACD line is above the signal line and conversely it reads negative when the MACD line is below the signal line. This gives the MACD the characteristics of an oscillator.
- Lastly, ‘convergence’ is the term used to confirm an existing trend when price movement, the MACD line pair and the histogram are in the same direction. Conversely, ‘divergence’ is the term used to confirm that a trend is waning when price movement is in the opposite direction to the MACD line pair and the histogram.
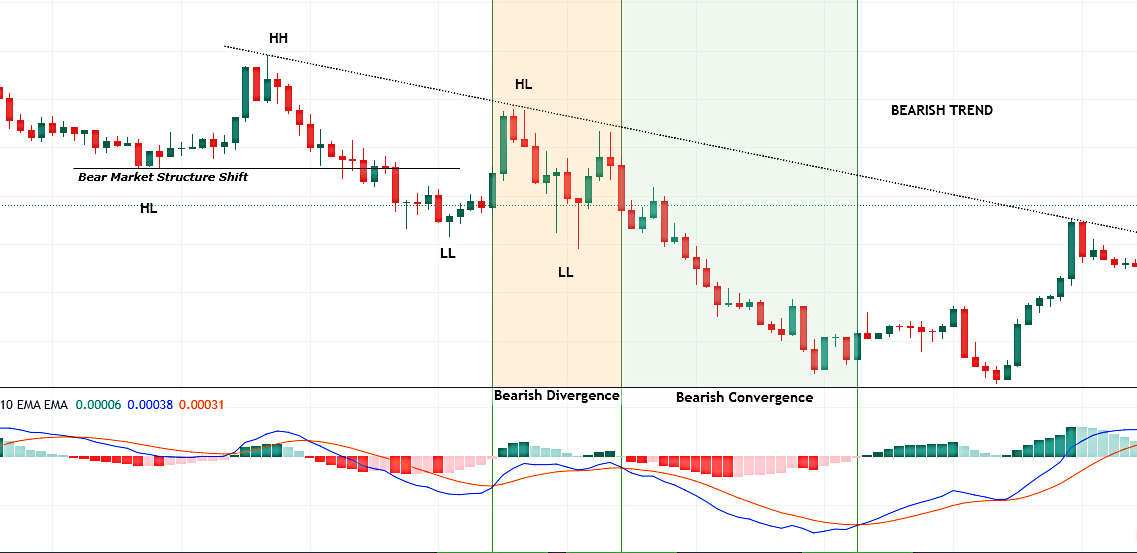
Image 2: Example of the MACD indicator convergence and divergence
SETTING UP THE MACD INDICATOR
Traders will have to follow a basic scheme when setting up the MACD indicator:
- Select a preferred time frame.
- Input the proper EMA parameters for that timeframe.
- Input the proper MACD SMA parameter for that timeframe.
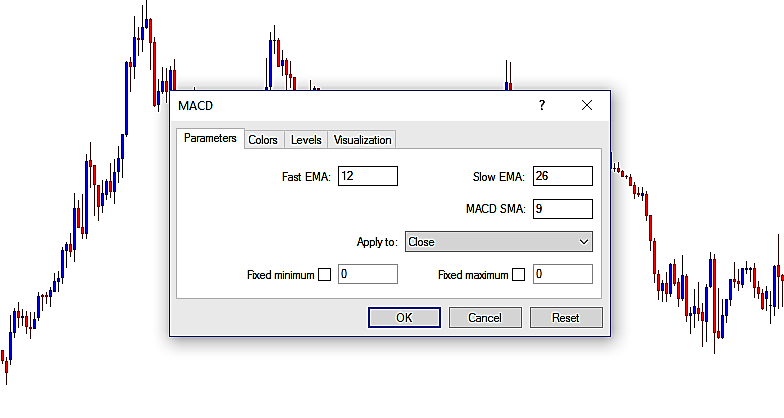
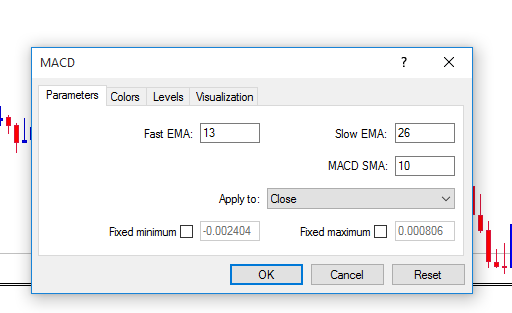
Image 3: MACD Indicator Setup
The MACD indicator has a default value of 12 and 26 exponential moving averages (EMA) and a 9-period simple moving average (SMA).
The default setting can be tweaked to fit varying trading strategies, trading styles and timeframes.
For instance, a position, long term or swing trader may prefer a much more sensitive input value like (5, 35, 5) on the monthly and weekly chart.
Reducing either of the two EMAs or the SMA will increase the number of trade signals while an increase in the SMA reduces the number of crossover signals thereby eliminating a bunch of false signals and also, it helps to monitor long term trends.
MACD TRADING STRATEGIES
Here are the various methods and trading strategies that can be implemented with the MACD indicator.
STRATEGY 1: ZERO LINE CROSS STRATEGY
This is the most simple and beginner trading strategy to implement the MACD indicator before moving to the complex methods.
Whenever the line pair (MACD line & Signal line) crosses through the zero line reference point from above. It confirms a bearish trend so therefore a sell market order can be executed to profit from the bearish trend.
And whenever the line pair (MACD line & Signal line) crosses through the zero line reference point from beneath. It confirms a bullish trend so therefore a buy market order can be executed to profit from the bullish trend.
Among all the MACD trading strategies, this one lags the most. So, therefore, It is better used as a confluence or supporting factor for a trade setup.
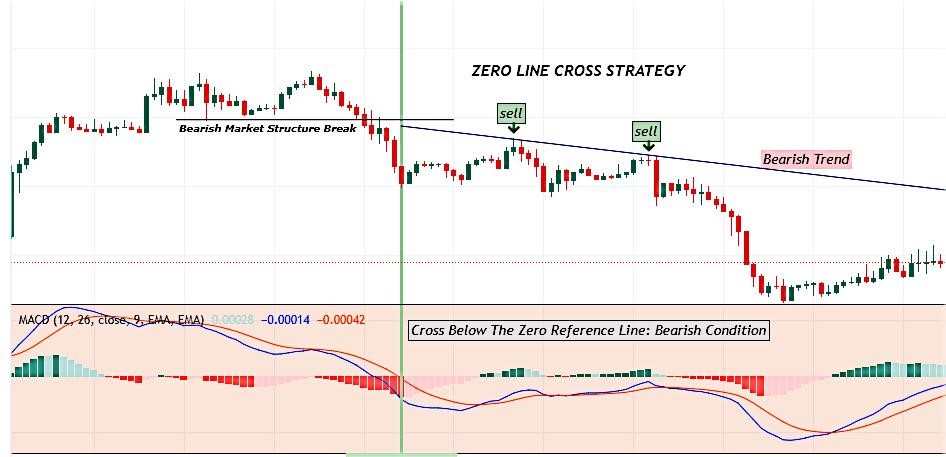
Image 4: Example of a MACD Zero Line Cross strategy trade ideas
STRATEGY 2: MACD & SIGNAL LINE CROSSOVER STRATEGY
The indicator usually provides a lot of crossover signals but a bunch of them are false. How then do we filter the right probable setups?
- First, we must confirm an existing trend to filter the right crossover signals that are in sync with the directional bias.
The first strategy or other preferred indicators can be used to determine the direction of a trend.
- Secondly, the zero reference line of the MACD indicator can be used as a built-in filter for false cross over signals. How?
Below the zero reference line, consider any long/buy crossover signal to be false and above the zero reference line, consider any short or sell crossover signals to be false.
- The third is the histogram filter. Unlike the lagging ‘zero line cross strategy’, the histogram signals are usually very effective and ahead of price movement. This is what makes it a vital component of the MACD indicator.
The histogram increase in height corresponds to price strength towards a particular direction and the histogram decrease in height from a peak means a change in price direction is imminent.
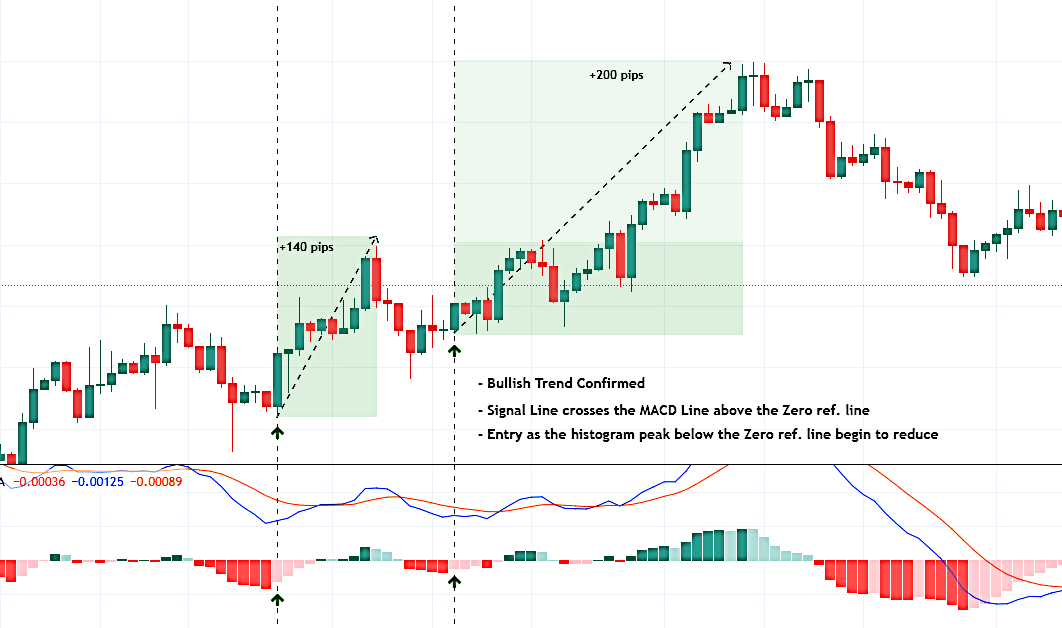
Image 5 5: MACD line & Signal Line crossover signal buy setups
Here is a summary of the MACD and Signal Line crossover strategy trading plan
- Determine if price is trending and the trend direction.
- For a long setup, the signal line must cross above the MACD line on top of the zero reference point.
- For a short setup, the signal line must cross below the MACD line under the zero reference point.
- If (2) is confirmed. Execute a long position when the histogram begins to decrease from a peak that was below the zero line.
- If (3) is confirmed. Execute a short position when the histogram begins to decrease from a peak that was above the zero line.
STRATEGY 3. HISTOGRAM DIVERGENCE STRATEGY
We just talked about the histogram being a vital component of the MACD indicator. It is also used to identify divergence i.e when price movement of an asset or a currency pair is asymmetric to that of the technical indicator.
In the case of the MACD, a bullish divergence setup is seen when price makes a new swing low (lower low) and the histogram fails to make a corresponding lower low. This is an example of a high probable bullish setup.
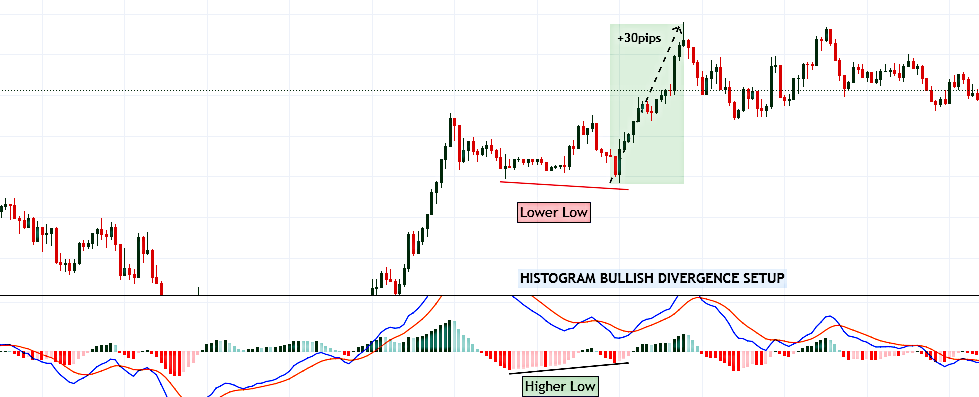
Image 6 6: Example of a MACD divergence buy setup
A bearish divergence setup is seen when price makes a new swing high (lower low) and the histogram fails to make a corresponding higher high. This is an example of a high probable bearish setup.
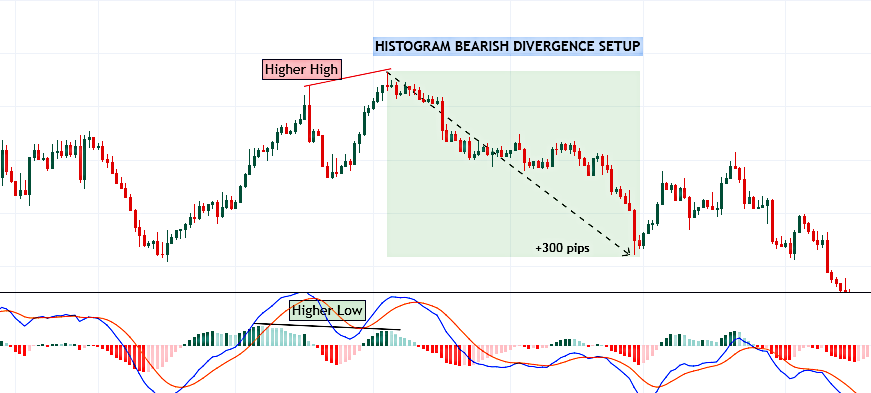
Image 7 7: Example of a MACD divergence sell setup
Profitable divergence setup against an existing trend is unlikely and unreliable because divergence may not lead to an immediate reversal even though the technique is sometimes used to signal a change in long term trend.
STRATEGY 4: OVERBOUGHT AND OVERSOLD
This is a resourceful strategy for profit management and reversal setups.
The bigger the divergence between the MACD line and the Signal line means that price is in an overbought or oversold condition, and so there is a high chance of price correction. Therefore, any ongoing trade in an overbought or oversold condition should be liquidated.
STRATEGY 5: MACD 1 MINUTE SCALPING TRADING STRATEGY
Scalping in forex is a short term trading style that aims to compound small consistent profits made out of small price movements.
The zero line cross strategy, MACD & Signal Line crossover strategy, histogram, divergence, overbought and oversold strategy can be applied to scalp the forex market profitably on lower time frames.
Although the strategies are unfit for scalping, the default parameters can be customized to enhance profitability when scalping on lower timeframes. Also other supporting tools can be implemented as well for confluence purposes.
Scalper should customize the default MACD input parameters to 13, 26, 10.
The other supporting factors implemented in this strategy is a high probable time zones and 2 moving averages.
High probable time zones: To minimize the time spent on charts searching for quality crossover signal setups, the most favourable to trade this setups is the London session (2 - 5am EST) and the New York session (7 - 11am EST).
The 2 moving averages: The 2 moving averages used is the 151 EMA and the 33 SMA, they both actact as dynamic support and resistance.
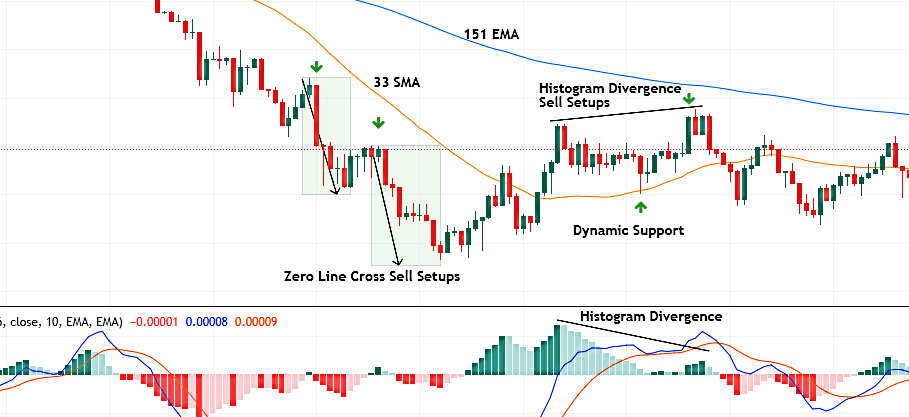
Image 9: Example of a MACD convergence and divergence
Image 9: Scalping opportunities on a lower timeframe: 1 min MACD scalping strategy
The market is assumed to be bullish whenever price is above the 151 EMA as support and only long setups should be considered. The market is assumed to be bearish whenever price is below the 151 EMA as resistance and only sell setups should be considered.
CHALLENGES OF THE VARIOUS MACD TRADING STRATEGIES
Of course, there are a lot of advantages of trading with the MACD but like all other indicators, it isn't perfect. There are a few disadvantages to using the MACD.
- The MACD is very effective as a trend and momentum indicator and so its usefulness is limited to trending markets.
- One of the main flaws of the MACD is that it gives the signals later than the price movement. This is because moving averages are based on previous price data.
- In addition, the MACD doesn’t provide ready-to-use stop loss or take profit levels.
- The divergence reversal signals don’t always work and also it doesn’t forecast all reversals.
CONCLUSION
It is important that traders practice using the MACD indicator and its strategies successfully on a demo account before trading real-live funds. A basic understanding of moving averages will aid a trader's use of the MACD indicator for optimal results.
Click on the button below to Download our "What is MACD strategy" Guide in PDF
