What is overbought and oversold in forex
In the forex market, price swings relative to any timeframe always extend to a point of overbought and oversold extreme regardless of the market patterns (uptrend, downtrend or consolidation) i.e. these extremes of the market or price swings is relative as well as subject to any market profile and any timeframe of the market.
Therefore, knowledge of these market profiles and how to operate the tide at overbought and oversold conditions is a major edge of a trader's skill set.
A steady and healthy trend (bullish or bearish) will always get to a point of buying or selling climax referred to as an overbought or oversold level for either just a retracement (pullback), a trend reversal or a period of consolidation.
MECHANISM OF OVERBOUGHT AND OVERSOLD IN FOREX
Overbought in forex is usually the extreme or the climax of a bullish price move or an uptrend where the demand of a forex asset is exhausted. This simply means that buyers have liquidated their long positions in profit at a price level where counterparty sellers have accumulated their short orders.
Likewise Oversold in forex is the extreme or climax of a bearish price move or a downtrend where the supply of a particular forex pair is exhausted. This means sellers have liquidated their short positions in profit at a price level where counterparty buyers have accumulation of long orders.
Also in a consolidation or ranging market, which is usually a result of indecision or balance of supply and demand.
The upper half of the high and the low of the consolidation is where supply is usually dominant hence it is considered to be an overbought zone. Also, the lower half of the consolidation or the range where demand is usually dominant is considered an oversold zone.
WHY MUST YOU UNDERSTAND THIS SUBJECT?
- To enhance understanding, proficiency and confidence in trading.
- To aid precise entry and exit decision making.
- To understand professional perspective about the forex market
- This is very important to know when a trend reversal may be imminent.
5. This insight helps to manage risk as well as risk exposure and also make more informed trading decisions.
UNIQUE APPROACHES TO IDENTIFY AND TRADE OVERBOUGHT AND OVERSOLD IN FOREX
1. CALIBRATE OVERBOUGHT AND OVERSOLD LEVELS ON A CLEAN PRICE CHART.
The interbank price delivery algorithm (IPDA) is based on 4 market profiles, which are consolidation, expansion, retracement and reversal. In these market profiles, there is always an oversold and overbought condition.
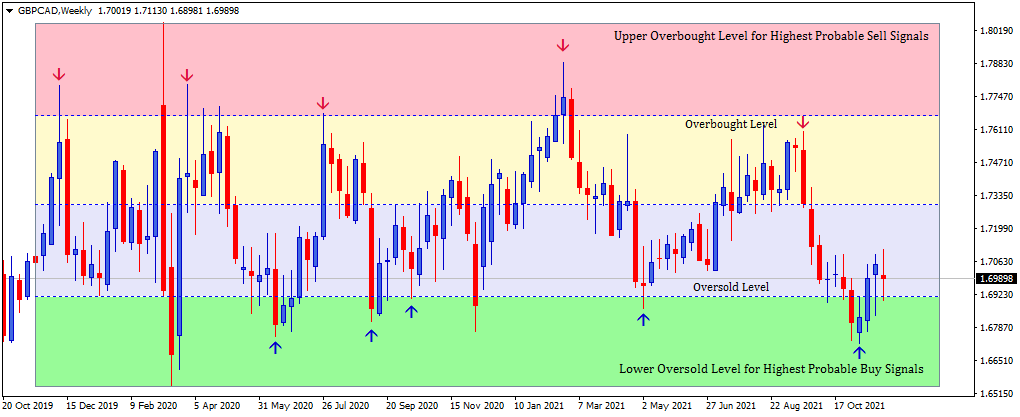
- CONSOLIDATION PROFILE: In a ranging or consolidating market profile, to define overbought and oversold zones, the highest point and the lowest point of the range is graded into 4 quarters. The upper quarter of the range is the highest probable overbought zone for sell signals. The lower quarter of the range is the highest probable oversold zone for buy signals.
(i) GBPCAD Weekly chart - Ranging Market
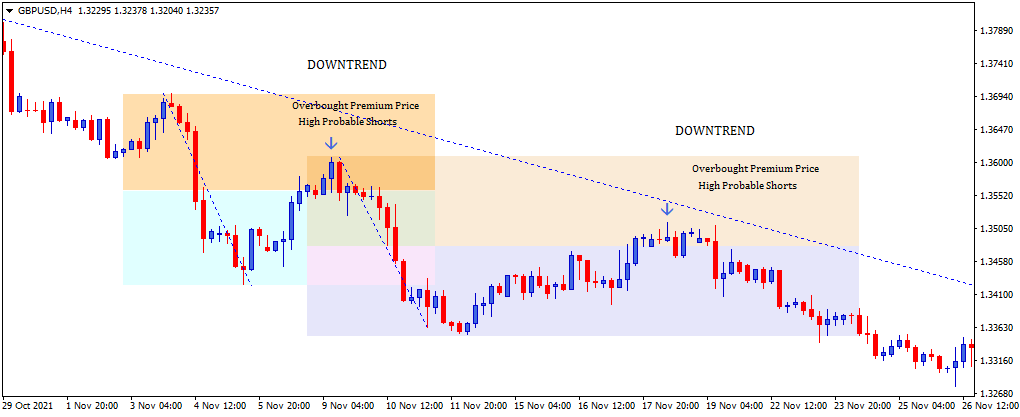
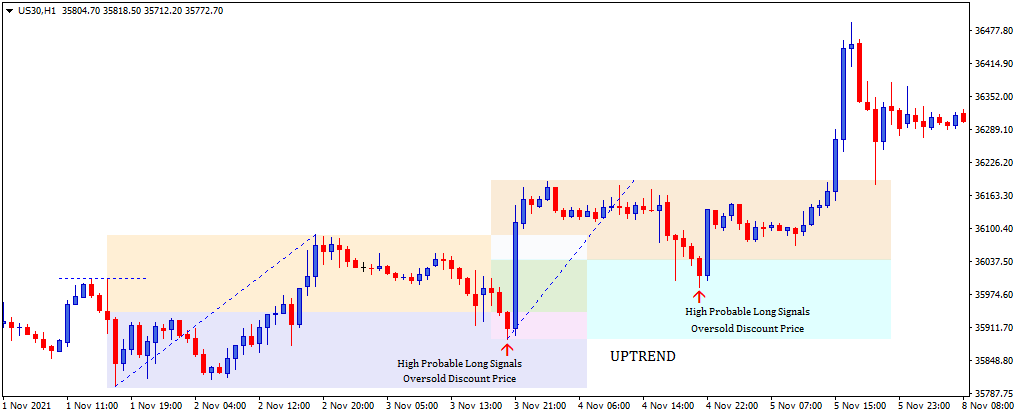
- TRENDING PROFILE: In a trending market profile which comprises an expansion swing, retracement (pullback) from the expansion and a reversal.
Overbought and oversold zones are calibrated by the following steps,
- Identify the high and the low of the impulsive price swing.
- Divide the dealing range of the impulsive price swing in half to designate premium and discount price levels.
- In a bullish trend, price move into a discount zone is considered oversold and ideal for buy signals. In a bearish trend, price move into the premium zone is considered overbought and ideal for sell signals.
(ii) US30 Hourly Chart - Uptrend (iii) GBPUSD Hourly Chart - Downtrend
- MULTIPLE TIMEFRAME ANALYSIS: Price is fractal (i.e. market patterns are the same on every timeframe), hence the application of overbought and oversold is subject and relative to all time-frames in its different market profile.
A timeframe (maybe larger) of a particular forex pair can be in a consolidating market profile while the lower timeframe may be trending.
(iv) GBPCAD Daily Bullish Trend in (i) GBPCAD Weekly Chart Consolidation
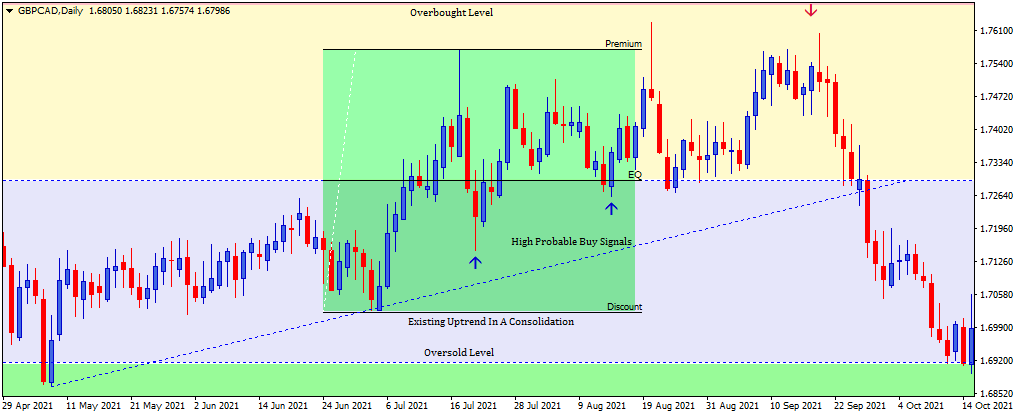
Also the interbank price delivery algorithm (IPDA) is universal across all time-frames, so the application of oversold and overbought in all time-frames and market conditions is very important.
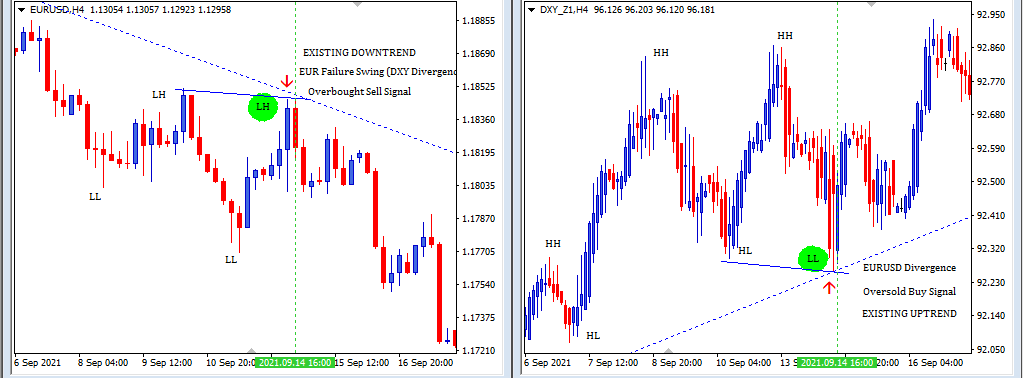
- SMT (SMART MONEY TECHNIQUE):
This is an intermarket analytical method used to identify overbought and oversold conditions by comparing the divergence in the price swings of correlated assets.
The divergence of correlated asset price swing is one of the strongest price action concepts that can be utilized as a trader because it reveals precise levels of overbought and oversold extremes by distinguishing weaker and stronger correlated assets. It is also used to identify institutional accumulation of long orders at oversold levels or institutional accumulation of short orders at overbought price levels for major price reversal.
For example, generally, a bearish US Dollar means bullish for foreign currencies such as EURUSD and vice versa
Bearish US Dollar making lower lows suggest that EURUSD will make higher highs. Whenever there is an asymmetric price move such that the US Dollar makes a lower low and EURUSD fails to make a higher high. This divergence in price swing suggests that EURUSD is overbought, US Dollar is oversold and a reversal is underway.
(v) EURUSD Overbought Scenario Opposite Correlation to Dollar
This tool applied in context with other confluences such as market profile (trend or consolidation), RSI, Stochastics, premium - discount calibration, can precisely identify the exact price point of buying climax (overbought level) or selling climax (oversold level) for either a price retracement (pullback) or a major trend reversal.
2. APPLICATION OF INDICATORS
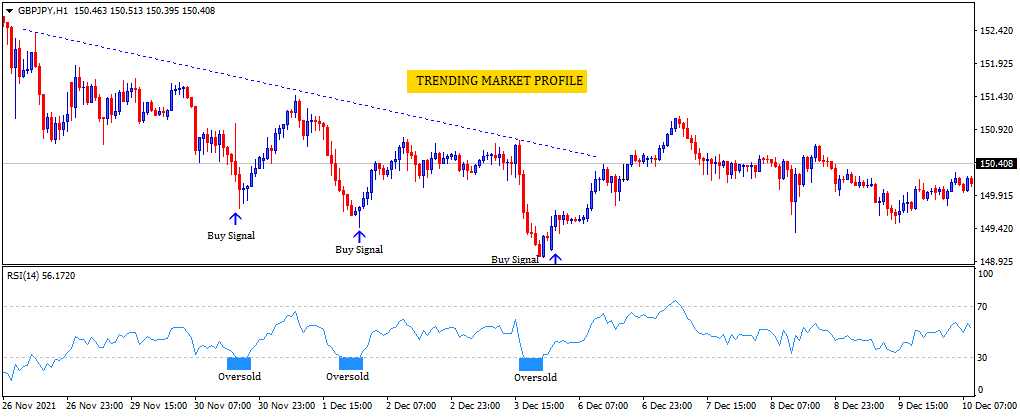
- RSI INDICATOR: The RSI is a momentum indicator used to indicate overbought or oversold price levels in forex pairs.
It is more useful in trending markets and is used to measure the strength of price movements, but is unsuitable for consolidating or sideway market.
Furthermore, It is used to form assumptions about how sustainable a trend is and how likely there is going to be a change in direction.
The RSI is calculated using the average of the high and low closing prices of a given period of time – usually 14 periods. It is presented on a percentage scale of 0 and 100.
If the scale is above 70, the market is considered to be overbought, and if it is below 30, it would be considered oversold.
For this reason, the market is prime for shorts when the RSI exceeds 70 and the market is prime for longs when the RSI reads below 30.
It’s important to note that the RSI can linger above or below these extreme price levels for a long time and so it is not ideal to instantly pick the top of an existing bullish trend or the bottom of an existing bearish trend with the assumptions that the market will turn because the markets can remain overbought or oversold for longer period of time.
(vi) GBPJPY Hourly Chart - Downtrend
How then do we know the market conditions are truly changing and there is an imminent reversal underway?
Using the RSI, the key is to wait until the indicator price scales back below 70 or above 30.
RSI buy and sell signals should always be evaluated within the context of the current trend in order to minimize risk and should also be used alongside other indicators for optimal results.
- STOCHASTIC INDICATOR: Stochastic is a simple momentum oscillator that also locates overbought and oversold price extremes but is more relevant in consolidating or non-trending market environment.
The stochastic indicator doesn’t rely on trending information to indicate when a market is overbought and oversold, and it can offer insights into exotic forex pairs for which price movements have little or no correlation.
How is it used?
The reading above the 80 level means that the pair is overbought and the reading below the 20 level suggests that the pair oversold.
(vii) GBPJPY Hourly Chart - Consolidation Profile
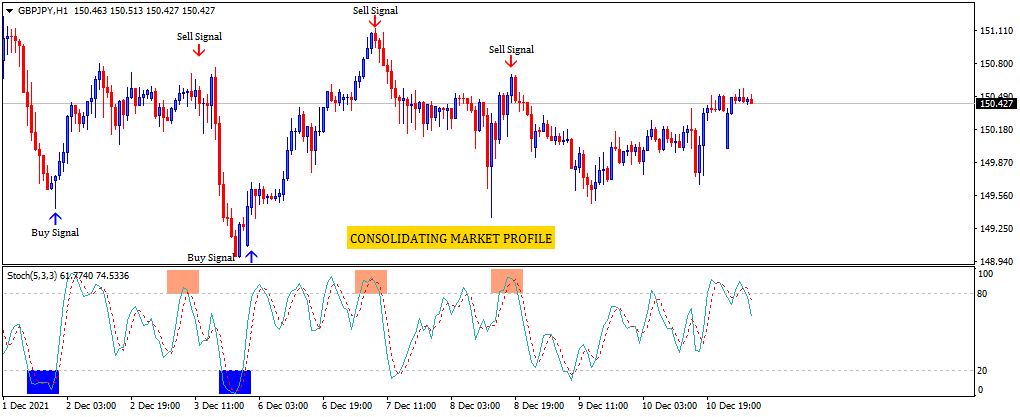
When the market is bullish, price tends to close at the extreme low of the scale and when the market is bearish, price tends to close at the extreme high of the scale. As price moves away from these extremes and toward the midpoint of the scale, this is most likely an indication that the momentum is exhausted and likely to change direction.
For accuracy and precision of overbought and oversold readings,
- You must examine price moves in respect to the reading on the stochastic indicator and also apply a trend indicator such as the moving average convergence/divergence (MACD) for confluence confirmation to confirm the direction and strength of the current trend.
- Traders can further validate the buy and sell signals produced by the overbought and oversold stochastic readings by looking for divergences and signal line crosses.
A divergence occurs when a forex pair makes a new high or a new low and the stochastic oscillator fails to make a similar high or low. Divergence is known to precede a trend reversal because price momentum (as measured by the stochastic oscillator) is an indication for a shift in direction before the price itself.
- The stochastic buy and sell signals can be used to complement the RSI overbought and oversold signals because RSI levels can linger in an overbought or oversold level for a longer period of time. The stochastic indicator aid in the precision of time and price momentum changes from the buying or selling climax.
Click on the button below to Download our "What is overbought and oversold in forex" Guide in PDF
