What is the best trend following indicator
The financial markets have a wide variety of trading indicators that serve different purposes. These indicators are helpful for analysing, trading and profiting off the ever-changing condition of price movement.
It is very important to categorise these indicators based on the purpose they serve and the market condition in which they are most useful both for price movement analysis and trading signals.
Throughout this article, we will review the top five best trend-following indicators that every trend trader can personally implement and develop into an ultimate trend-following strategy.
Trend trading alongside the current momentum of the price movement has proven to be the best and most profitable art of trading because the only trades considered highly probable are the trade setups in the direction of the trend.
Therefore applying the right strategy with the right trade setup in the direction of the trend will always have an explosive price move and not to mention, the trend can also bail out a trader from an imperfect trade setup.
By definition, trend trading can be defined as analyzing and trading a fixed asset's momentum in one direction in order to capture high probable gains.
The overall direction of price movement either upward or downward on any timeframe is referred to as a trend and then trend traders, analyses an asset in an uptrend for the highest probable bullish trade setup and also analyse an asset in a downtrend for the highest probable bearish trade setup.
In order to trade efficiently and profit from an uptrend or downtrend with a perfect trade entry and exit, it is important that trend traders take advantage and utilise the trend following indicators because they are useful to trend traders in a number of ways
- They alert the technical analyst of an imminent trend or an impending reversal.
- They identify the climax of a trending price move.
- Provide high probable trend trade setups.
- They attempt to predict short and long-term price direction.
- They provide further confirmations to trade signals from price patterns and other technical indicators.
Trading styles and trading personalities do vary so therefore, every indicator based trader is going to prefer a different type of trend following indicator.
But in order to develop an ultimate trend-following strategy, it is very important that trend traders combine two or more trend-following indicators for further confirmation and confluence purposes.
How to locate your best trend following indicator on MetaTrader (MT4)
Find and click on the ‘insert’ at the top left corner of your screen.
Next, click on ‘indicator’. A few indicators and some categories of indicators will be displayed.
Apart from the categorised trend indicators, there are indicators in the other categories that work best as trend-following indicators.
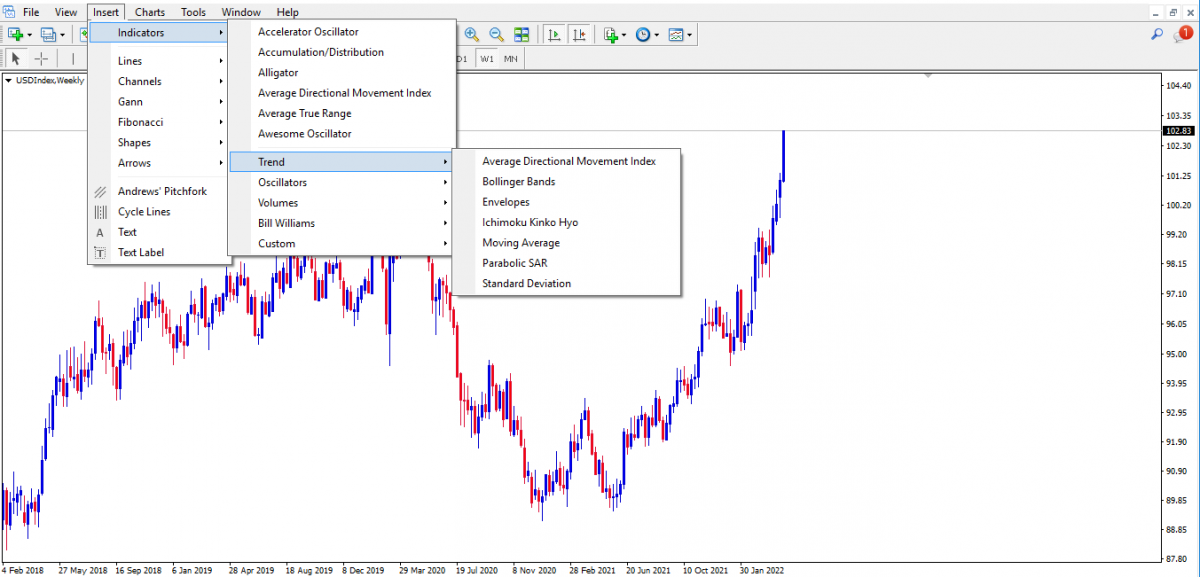
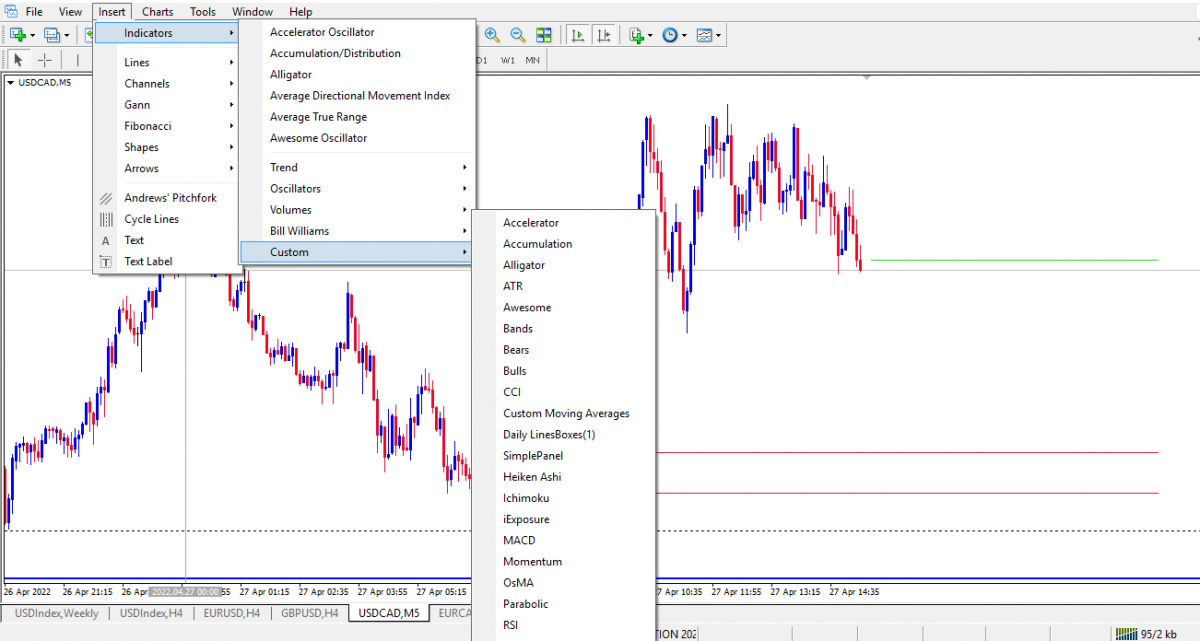
Image of trend-following indicators
Some of these trend-following indicators are plotted over price movement thus displaying sell signals above price movement and buy signals below price movement. Other trend-following indicators are displayed below the price chart, measuring the strength of price movements usually within a scale of 0 to 100 or across a central ‘zero’ line, thus generating bullish, bearish and divergences signals.
Beginners and aspiring trend traders must first choose their best trend-following indicator and then add up one or two indicators to come up with an ultimate trend trading strategy.
For that reason, we must review all the available trend following indicators and also differentiate between lagging and leading indicators.
Although most trend-following indicators are lagging and some of them function as both lagging and leading indicators.
Here is a list of the top 5 best trend-following indicators
- Moving averages
Moving averages is arguably the most popular technical analysis tool for identifying trends in price movement. They come in different methods as listed below
- simple moving average
- exponential moving average
- Smoothed moving average
- linear weighted moving average
These different methods of moving averages all follow the same principle on a price chart.
When plotted over a price chart, they are usually represented by a single line that smoothens out the data point of price movement over a set period of time effectively eliminating the variations of random price fluctuation in any time frame.
The simple moving average and the exponential moving average are the most commonly used moving average methods. The difference between the two moving averages methods is that the exponential moving average also referred to as ‘the weighted moving average’ reacts quickly to price changes thus providing early buy and sell signals because it focuses more on recent price data than a long series of data points as simple moving average requires.
Here are the basic functions of the moving average indicator
- They identify the trend by the slope of the moving average over price movements.
- They provide dynamic support and resistance levels above and below price movement for buy and sell signals.
- Traders and technical analysts can also combine 2 to 3 moving averages over price movements to provide buy signals with bullish moving average crossovers and sell signals with bearish moving average crossovers.
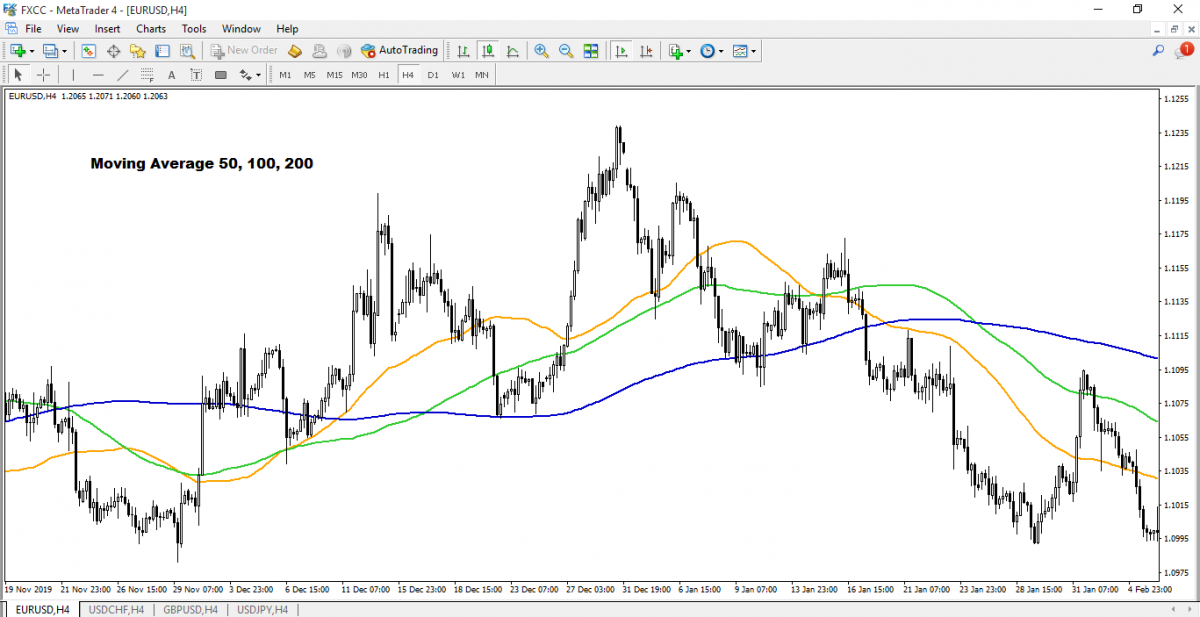
Long term traders prefer to use or combine either 50, 100, or 200 moving averages
Short term traders and scalpers prefer to use or combine either 10, 20 or 33 moving averages
The combination of two or more moving averages and all the functions to provide accurate trade setups can make the best trend following strategy.
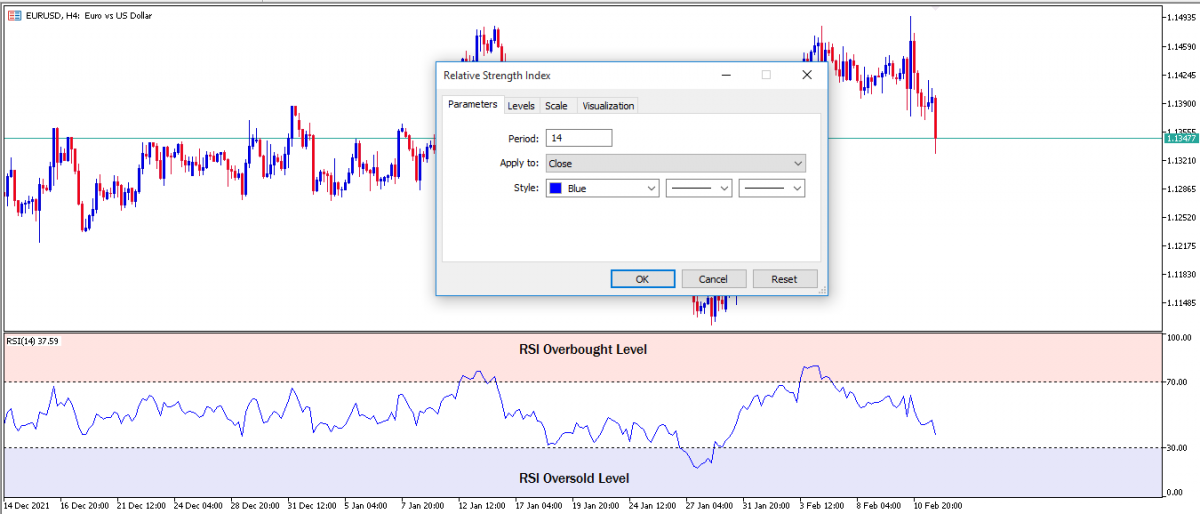
- Relative Strength Index
RSI is a special indicator that tells a lot about the momentum and condition of price movements by measuring the strength of recent changes in price movement.
The RSI is interpreted by a single moving line within a scale of 0 to 100 interpreted as overbought above the 70 level and oversold below the 30 level.
The line representing the relative strength index of price movement is calculated with the default look-back period of 14. The input setting of the look-back period can be adjusted to produce fewer or more signals.
The overbought and oversold signal of the RSI indicator serves varying purposes in a trending market.
In an uptrend, the RSI reads oversold when a bearish retracement is over and a high probable bullish expansion is imminent.
At the same time, the RSI can also read overbought, a telling sign of possible retracement or reversal from a trending price move.
In a downtrend, the RSI reads overbought when a bullish retracement is over and a high probable bearish expansion is imminent.
At the same time, the RSI can also read oversold, a telling sign of possible bullish retracement or bullish reversal from a bearish trending price move.
Divergence signal is also a highly probable concept of the RSI used to identify subtle shifts between supply and demand of market participants.
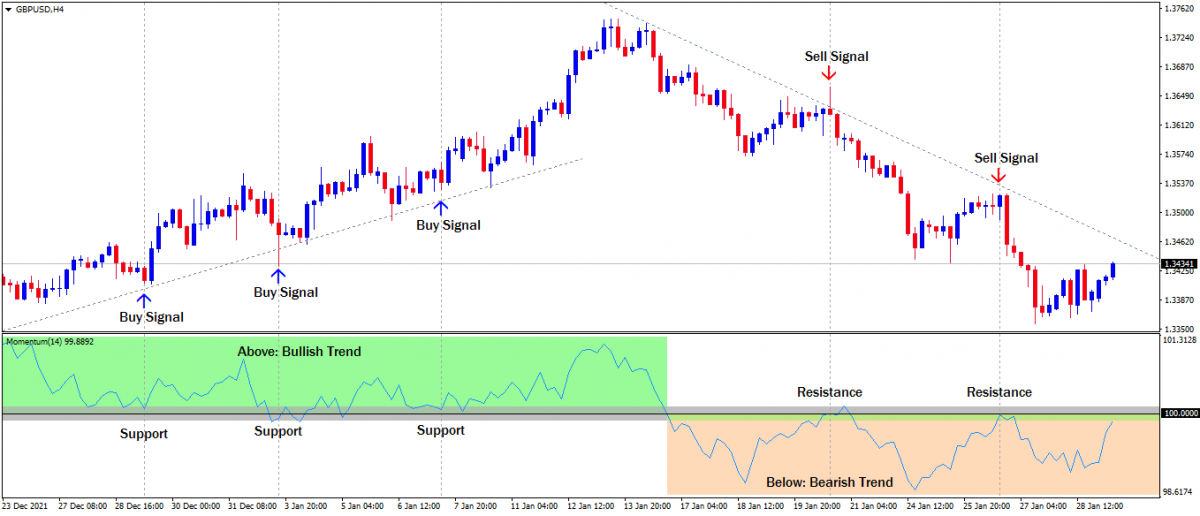
- Momentum indicator
This is another special oscillating indicator that measures the strength of price movements by comparing the most recent closing prices to a previous closing price from any timeframe.
The momentum indicator uses a 100 level horizontal line (standard reference point) as a basis for bullish and bearish signals.
If the line of the momentum indicator rises above the 100 level reference points it indicates an uptrend. If the line falls below the 100 level reference points it indicates a downtrend.
If below the 100 level reference point, the indicator line begins to rise. This doesn't mean a direct bullish reversal of a downtrend. It suggests that the current bearish trend or momentum to the downside is waning.
Trend following strategies using the momentum indicator includes the following
100 level reference point crossover strategy.
- Sell at a bearish crossover below the 100 level reference point
- Buy at a bullish crossover above the 100 level reference point
Overbought and oversold strategy
- In an uptrend, buy when the momentum indicator reads oversold
- In a downtrend, sell when the momentum indicator reads overbought
Divergence trading strategy
- Sell at a bearish divergence signal
- Buy at a bullish divergence signal
- Bollinger Bands
Bollinger bands make a unique trend following indicator in that it acts as both a leading and lagging indicator.
The indicator has the structure of a channel-like envelope which is made up of statistically plotted upper and lower moving averages and a simple moving average at the centre.
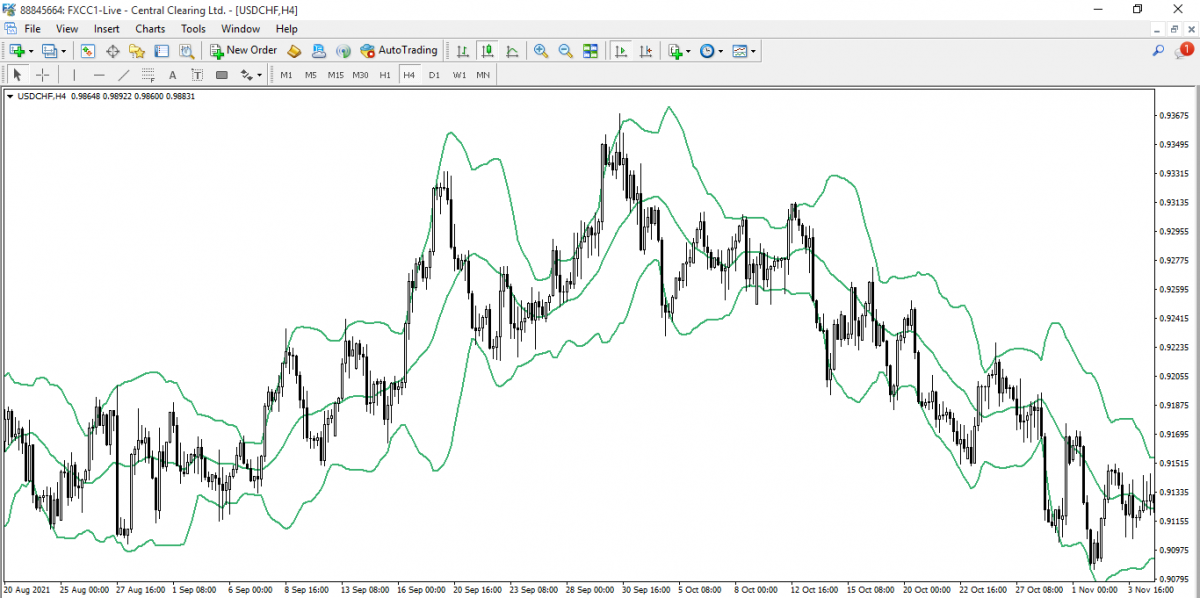
It measures the relationship between price movement and the volatility of an asset or forex pair over a period of time.
Bollinger Bands squeeze and breakout is a trading strategy that can be used to predict the direction of an imminent trend.
The indicator identifies a trending market by increasing the width between the upper and the lower line of the band.
Traders can further use the simple moving average at the center of the channel to determine the dominant direction of price movement and if the asset or forex pair is actually trending or not.
- Ichimoku cloud Indicator:
Also known as “Ichimoku Kinko Hyo”, it has similar characteristics to the Bollinger Bands.
The Ichimoku cloud serves as a momentum-based trend-following indicator used to identify high probability trading opportunities in an established trending market by highlighting dynamic price levels of support and resistance.
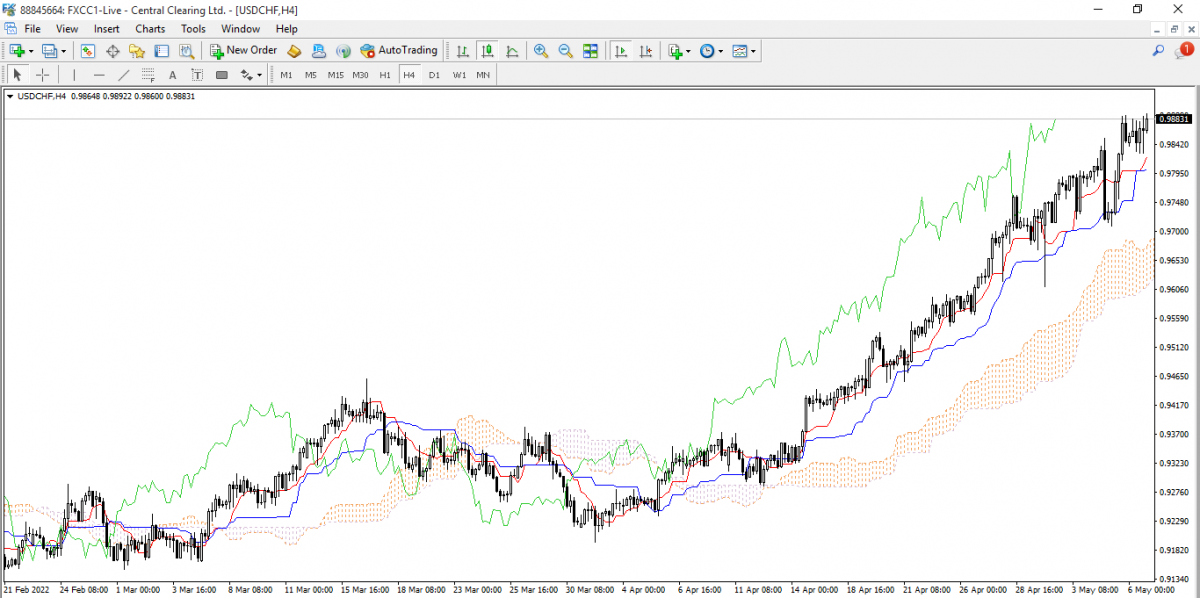
The indicator has some interesting technical components that make it a trading system itself. The technical components include the Cloud, a conversion line known as Tenkan Sen, a baseline known as Kijun Sun, and a green coloured line known as the Chikou Span.
It is considered one of the best trend following indicators.
Conclusion
As a popular saying goes, there is no Holy Grail in forex trading. That said it is the responsibility of the forex trader to develop his or her own ultimate trading strategy combining the best trend-following indicators as described above with one or two other trend-following indicators.
Click on the button below to Download our "What is the best trend following indicator" Guide in PDF
